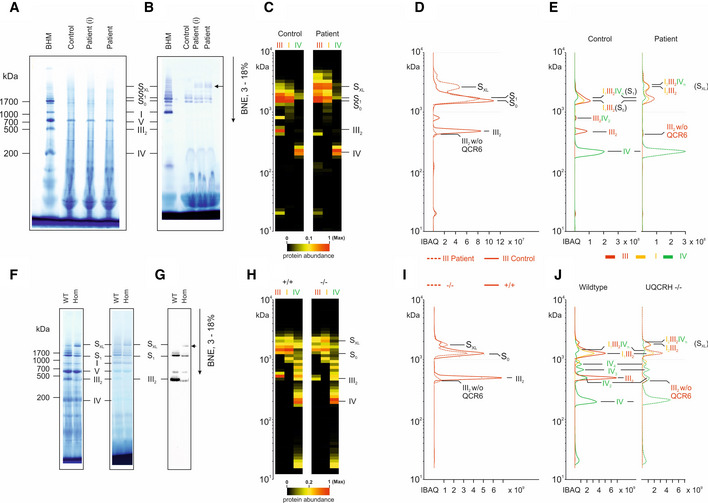
Mitochondrial membranes from fibroblasts of control (WT) and patient fibroblasts (i, immortalised) (upper panels) and heart tissue from wild‐type (WT) and
mice (lower panels) were solubilised with digitonin and separated on native gradient gels.
BN‐PAGE gel stained with Coomassie showing molecular weight marker (BHM) and samples from control and patient (primary fibroblasts, (I) = immortalised fibroblasts).
BN‐PAGE gel stained with NADH:NTB reductase activity stain showing molecular weight marker (BHM) and samples from control and patient (primary fibroblasts, (I) = immortalised fibroblasts).
Further complexome analysis of the BN‐PAGE gels shown in A and B. Each native lane was cut into even fractions from high to low molecular mass. Proteins in each slice were digested with trypsin and analysed by quantitative mass spectrometry. Shown here are average IBAQ values of all identified subunits from complexes III, I and IV (full data including all individual subunits shown in Fig
EV4).
Profile of complex III (averaged IBAQ values) in the patient (dashed line) and control (solid line) fibroblasts.
Profile of complexes III (red), I (yellow) and IV (green) to visualise and assess supercomplex composition and stability in control (solid lines) and patient (dashed lines) fibroblasts.
BN‐PAGE gel stained with Coomassie (left) and NADH:NTB reductase activity stain (right) showing molecular weight marker (BHM) and heart tissue samples from wild‐type (WT) and Uqcrh
−/− mice.
BN‐PAGE and immunoblot using the antibody to CIII subunit UQCRC2 in heart tissue samples from wild‐type (WT) and Uqcrh
−/− mice.
Further complexome analysis of the BN‐PAGE gels shown in F, shown here are average IBAQ values of subunits from complexes III, I and IV (full data including all individual subunits shown in Fig
EV4).
Profile of complex III (averaged IBAQ values) in wild‐type (+/+, solid line) and Uqcrh
−/− (−/−, dashed line) heart tissue.
Profile of complexes III (red), I (yellow) and IV (green) to visualise and assess supercomplex composition and stability in wild‐type (+/+, solid line) and Uqcrh
−/− (−/−, dashed line) heart tissue.

