
Figure EV5. Alteration of the relative distribution of individual respiratory chain complexes and supercomplexes.
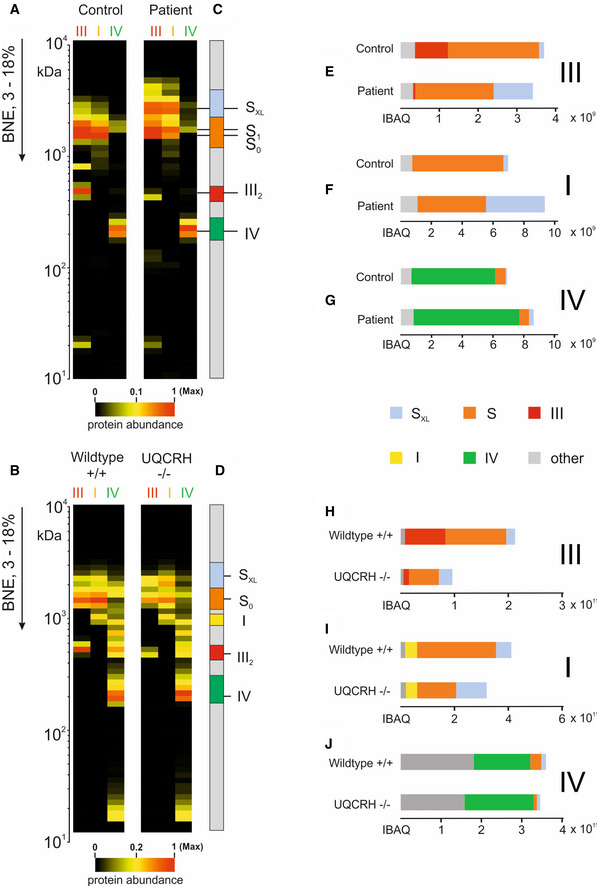
Mitochondrial membranes from fibroblasts of control (WT) and patient fibroblasts (upper panels, A–G) and heart tissue from wild‐type (WT) and Uqcrh−/− mice (lower panels, B–J) were analysed by complexome profiling and the appearance of individual complexes and superassemblies were quantified.
-
A, BThe average of IBAQ values of all identified subunits from complexes III, I and IV (full data including all individual subunits shown in Fig EV4).
-
C, DMolecular mass region used to quantify the appearance of individual and supercomplexes.
-
E, HSum of all IBAQ values and relative distribution of complex III as individual dimer or assembled into supercomplexes and large supercomplexes.
-
F, ISum of all IBAQ values and relative distribution of complex I as individual or assembled into supercomplexes and large supercomplexes.
-
G, JSum of all IBAQ values and relative distribution of complex IV as individual or assembled into supercomplexes.
Data information: Assignment of complexes: I, complex I; III2, complex III dimer; IV, complex IV; S0, supercomplex containing complex I and a dimer of complex III; S1, supercomplex containing complex I, a dimer of complex III and 1 copy of complex IV, SXL, Supercomplex or Megacomplex containing I, III and higher signals also additional copies of IV.