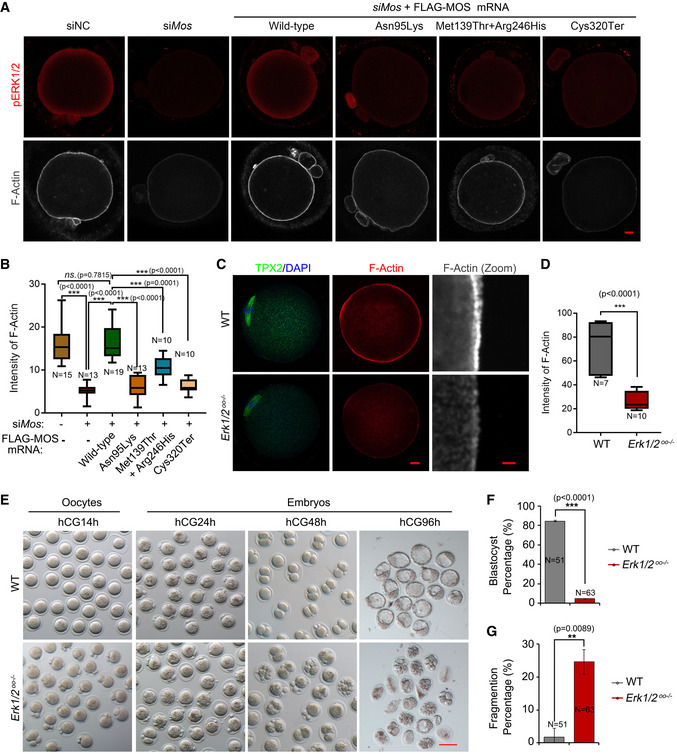
Figure 3. Oocyte MOS‐ERK1/2 pathway inactivation perturbs cortical F‐actin assembly and causes early embryonic arrest and fragmentation.

-
AImmunofluorescence of FLAG (red) and F‐actin (gray) in oocytes after microinjection of negative control or mouse Mos siRNAs combined with or without wild‐type human MOS or MOS variants mRNAs and culture in medium with 2.5 µM milrinone for 24 h, followed by release to maturation (n = 15–20 oocytes each group). Scale bar = 10 µm.
-
BThe relative intensities of F‐actin were measured and compared among the indicated groups. The oocyte numbers for analyzed were labeled in each group. The box plot showing the F‐actin intensities distribution in each group quantified using Image J (n = 10–19/group).
-
CThe immunofluorescence of F‐actin (red) and TPX2 (green) in WT and Erk1/2oo −/− oocytes, using DAPI (blue) co‐staining (n = 15–20 oocytes for each group). The zoomed images of F‐actin are displayed in gray. Scale bar = 10 µm.
-
DThe box plot summarizing the relative intensities of F‐actin between control and ERK1/2oo −/− oocytes (n = 7–10 oocytes for each group).
-
ERepresentative bright‐field images showing the morphology of oocytes and embryos from wild‐type and ERK1/2oo −/− mice. The MII oocyte, zygote, two‐cell, and blastocyst embryos were harvested in vivo at 14, 24, 48, and 96 h post‐hCG, respectively (n = 3 mice for each time points in two groups). Scale bar = 100 µm.
-
F, GBar graphs shows the blastocyst percentage (F) and fragment percentage (G) in wild‐type (n = 51) and maternal ERK1/2 deletion embryos (n = 63).
Data information: For B and D, the line in the box plot represents the median value of F‐actin intensity. Main box represents the values from the lower to upper quartile (25th to 75th percentile). The lower and upper whiskers indicate the min to max values. For (F) and (G), data are represented as mean ± SD. One‐way ANOVA with Tukey’s multiple comparisons test (B) and unpaired two‐tailed Student’s t‐test (D, F, and G) were used for statistical analysis. **P < 0.01, ***P < 0.001; ns., no significance.
Source data are available online for this figure.
