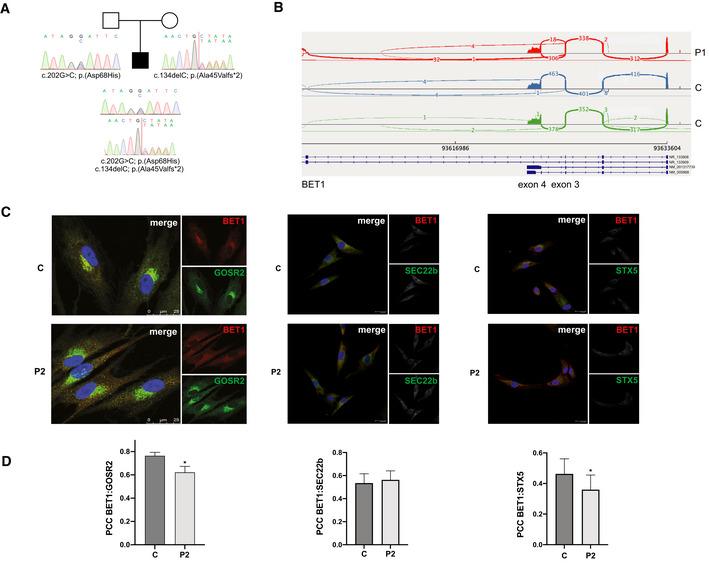
Figure EV1. Genetic studies in P1.

- Pedigree of P1 with corresponding BET1 Sanger chromatogram depicting the paternally inherited c.202G>C; p.(Asp68His) missense variant and a maternally inherited c.134delC; p.(Ala45Valfs*2) frameshift variant (NM_005868), consistent with recessive inheritance.
- Sashimi plots comparing fibroblast RNA sequencing reads in P1 (red) and two control muscle samples (blue and green) at the exons 3–5 of BET1.
- Immunofluorescence images of BET1 (red) and GOSR2 (green) in fibroblasts from P1, P2, and control. In P1, BET1 immunoreactivity is reduced. Scale bar: 25 μm.
- In the overlay, BET1 colocalization with GOSR2 and Syntaxin‐5 is reduced in P2 compared to controls while BET1 colocalization with SEC22b is unchanged. BET1 colocalization was determined using Pearson’s correlation coefficient (PCC) on regions of interest (ROIs) drawn around cells (GOSR2 P2: n = 56; C: n = 86, P = 0.0025) (Syntaxin‐5 P2: n = 27; C: n = 32 P = 0.0006) (SEC22b P2: n = 27; C: n = 30, P = 0.2093). (*P ≤ 0.05 Mann–Whitney U‐test). Data represented are mean ± SEM.
