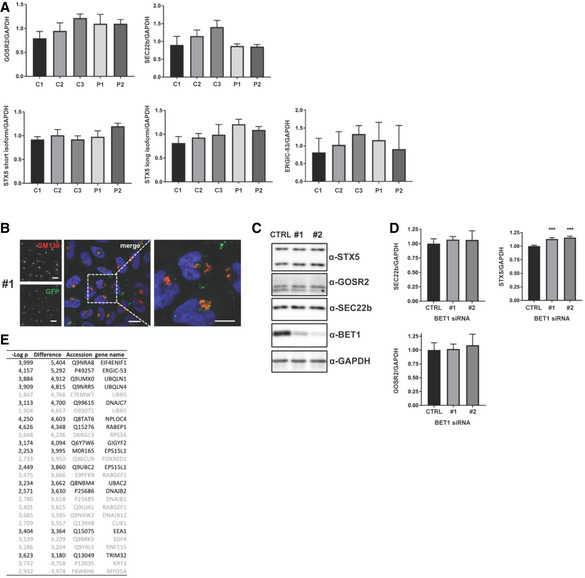
Figure EV2. Normal SNARE complex partners in BET1 fibroblasts with reduced colocalization at the cis‐Golgi in transfected cells.

- Quantification of protein levels of BET1 SNARE complex partners and the novel interaction partner ERGIC‐53 in fibroblasts. Values are normalized to GAPDH. No significant differences between the control and patient fibroblasts were detected. Data represented are mean ± SD of four biological replicates. Significant differences were analyzed by one‐way ANOVA followed by Tukey's post hoc test.
- Immunofluorescence images of BET1 knockdown HeLa pC4 cells transfected with BET1 siRNA #1 10 min after induction of ER‐to‐Golgi transport with solubilizer. Scale bar: 20 µm.
- HeLa pC4 cells were transfected with control siRNA (ctrl) or siRNA against BET1 (#1 and #2) and protein levels of BET1 and ER‐to‐Golgi complex SNAREs SEC22b, Syntaxin‐5, and GOSR2 were analyzed by immunoblot. *residual SEC22b signal after immunoblot stripping.
- Quantification of EV2C. Data represented are mean ± SD of three biological replicates. Significant differences to ctrl cells were analyzed by one‐way ANOVA followed by Dunnett’s post hoc test. ***P ≤ 0.001.
- Table showing a spectral count‐based summary of three independent AP‐MS experiments with significant hits shown in Fig 5A. Hits are sorted by the difference of BET1‐WT and BET1‐Ile51Ser. Hits which do not fulfill the criteria to have a mock‐transfected spectral count of two or less are colored in grey.
