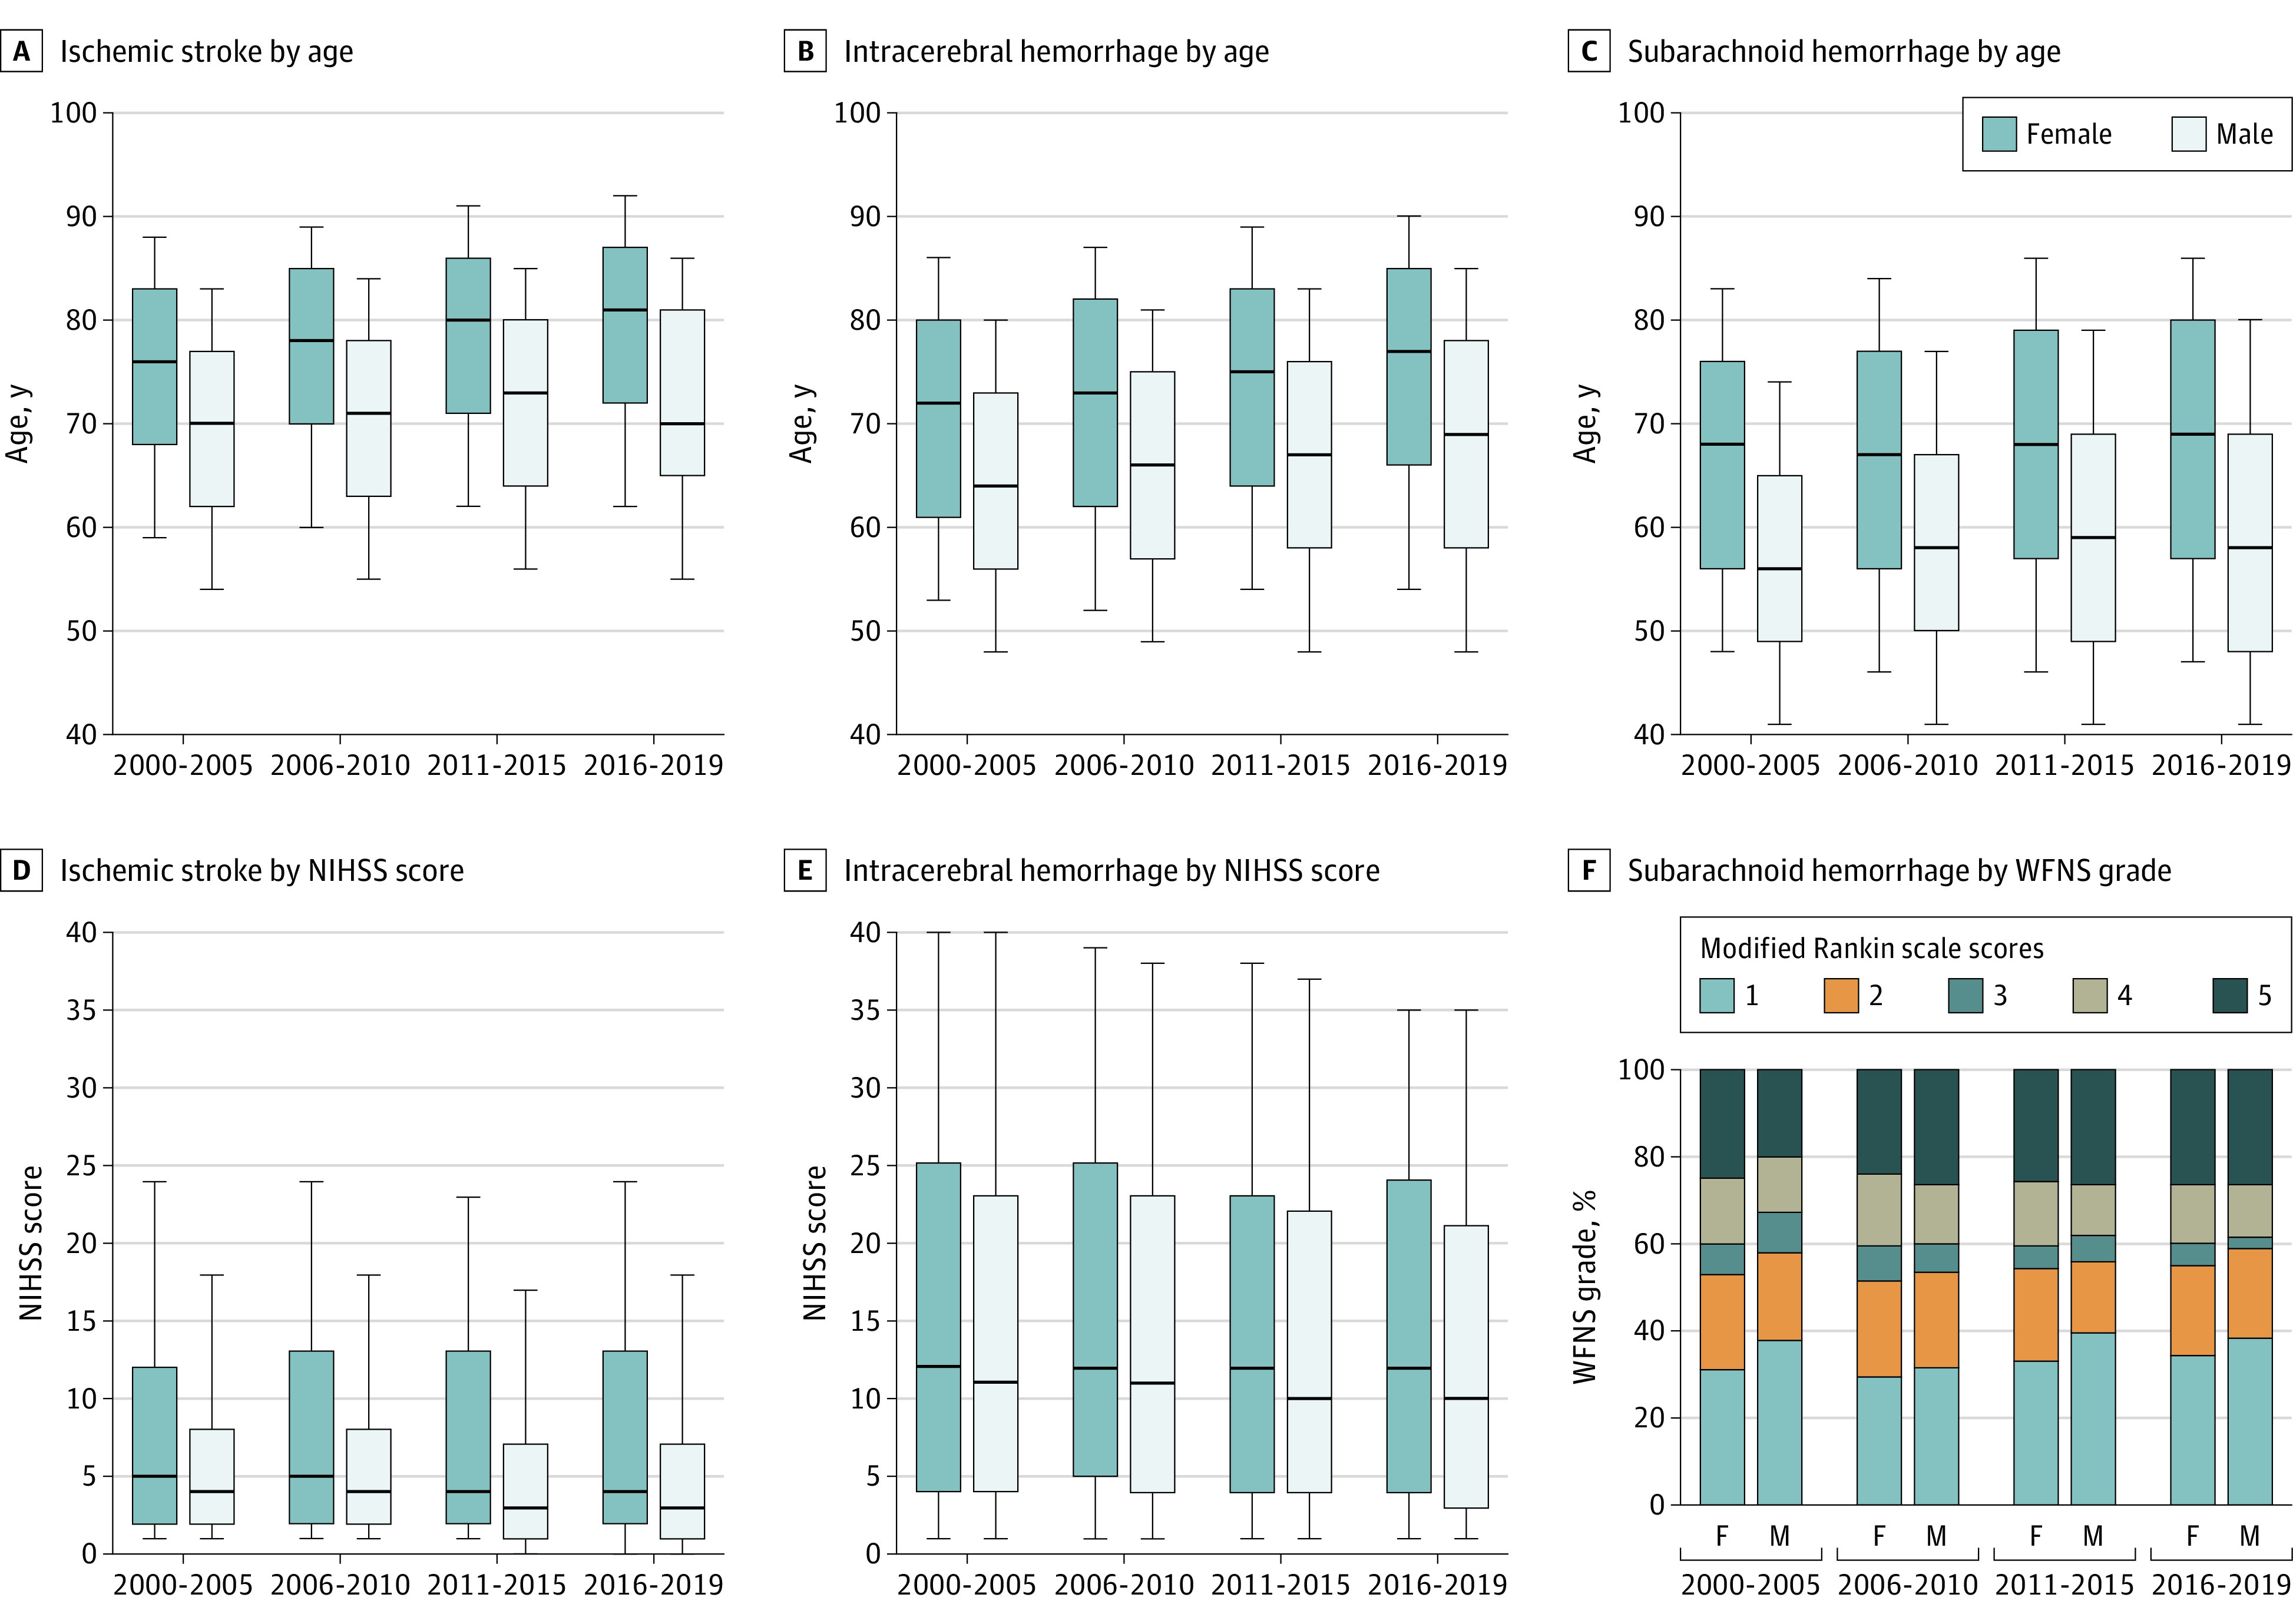
Figure 1. Age, National Institutes of Health Stroke Scale (NIHSS) Scores, and World Federation of Neurological Surgeons (WFNS) Grades at the Emergent Visit by Sex.

Boxes represent interquartile range, and lines across boxes indicate median values. Whiskers represent 10th percentile and 90th percentile values. All P values for sex differences in age are <.001. All P values for sex differences in NIHSS scores for ischemic stroke are <.001. P values for sex differences in NIHSS scores for intracerebral hemorrhage are .06 in 2000-2005, .006 in 2006-2010, .002 in 2011-2015, and <.001 in 2016-2019. P values for sex differences in WFNS grades are <.001 in 2000-2005, .81 in 2006-2010, 0.11 in 2011-2015, and .02 in 2016-2019. All P values for trends of age and NIHSS scores are <.001 in both sexes. P values for trends of WFNS grades are .28 for women and .64 for men.
