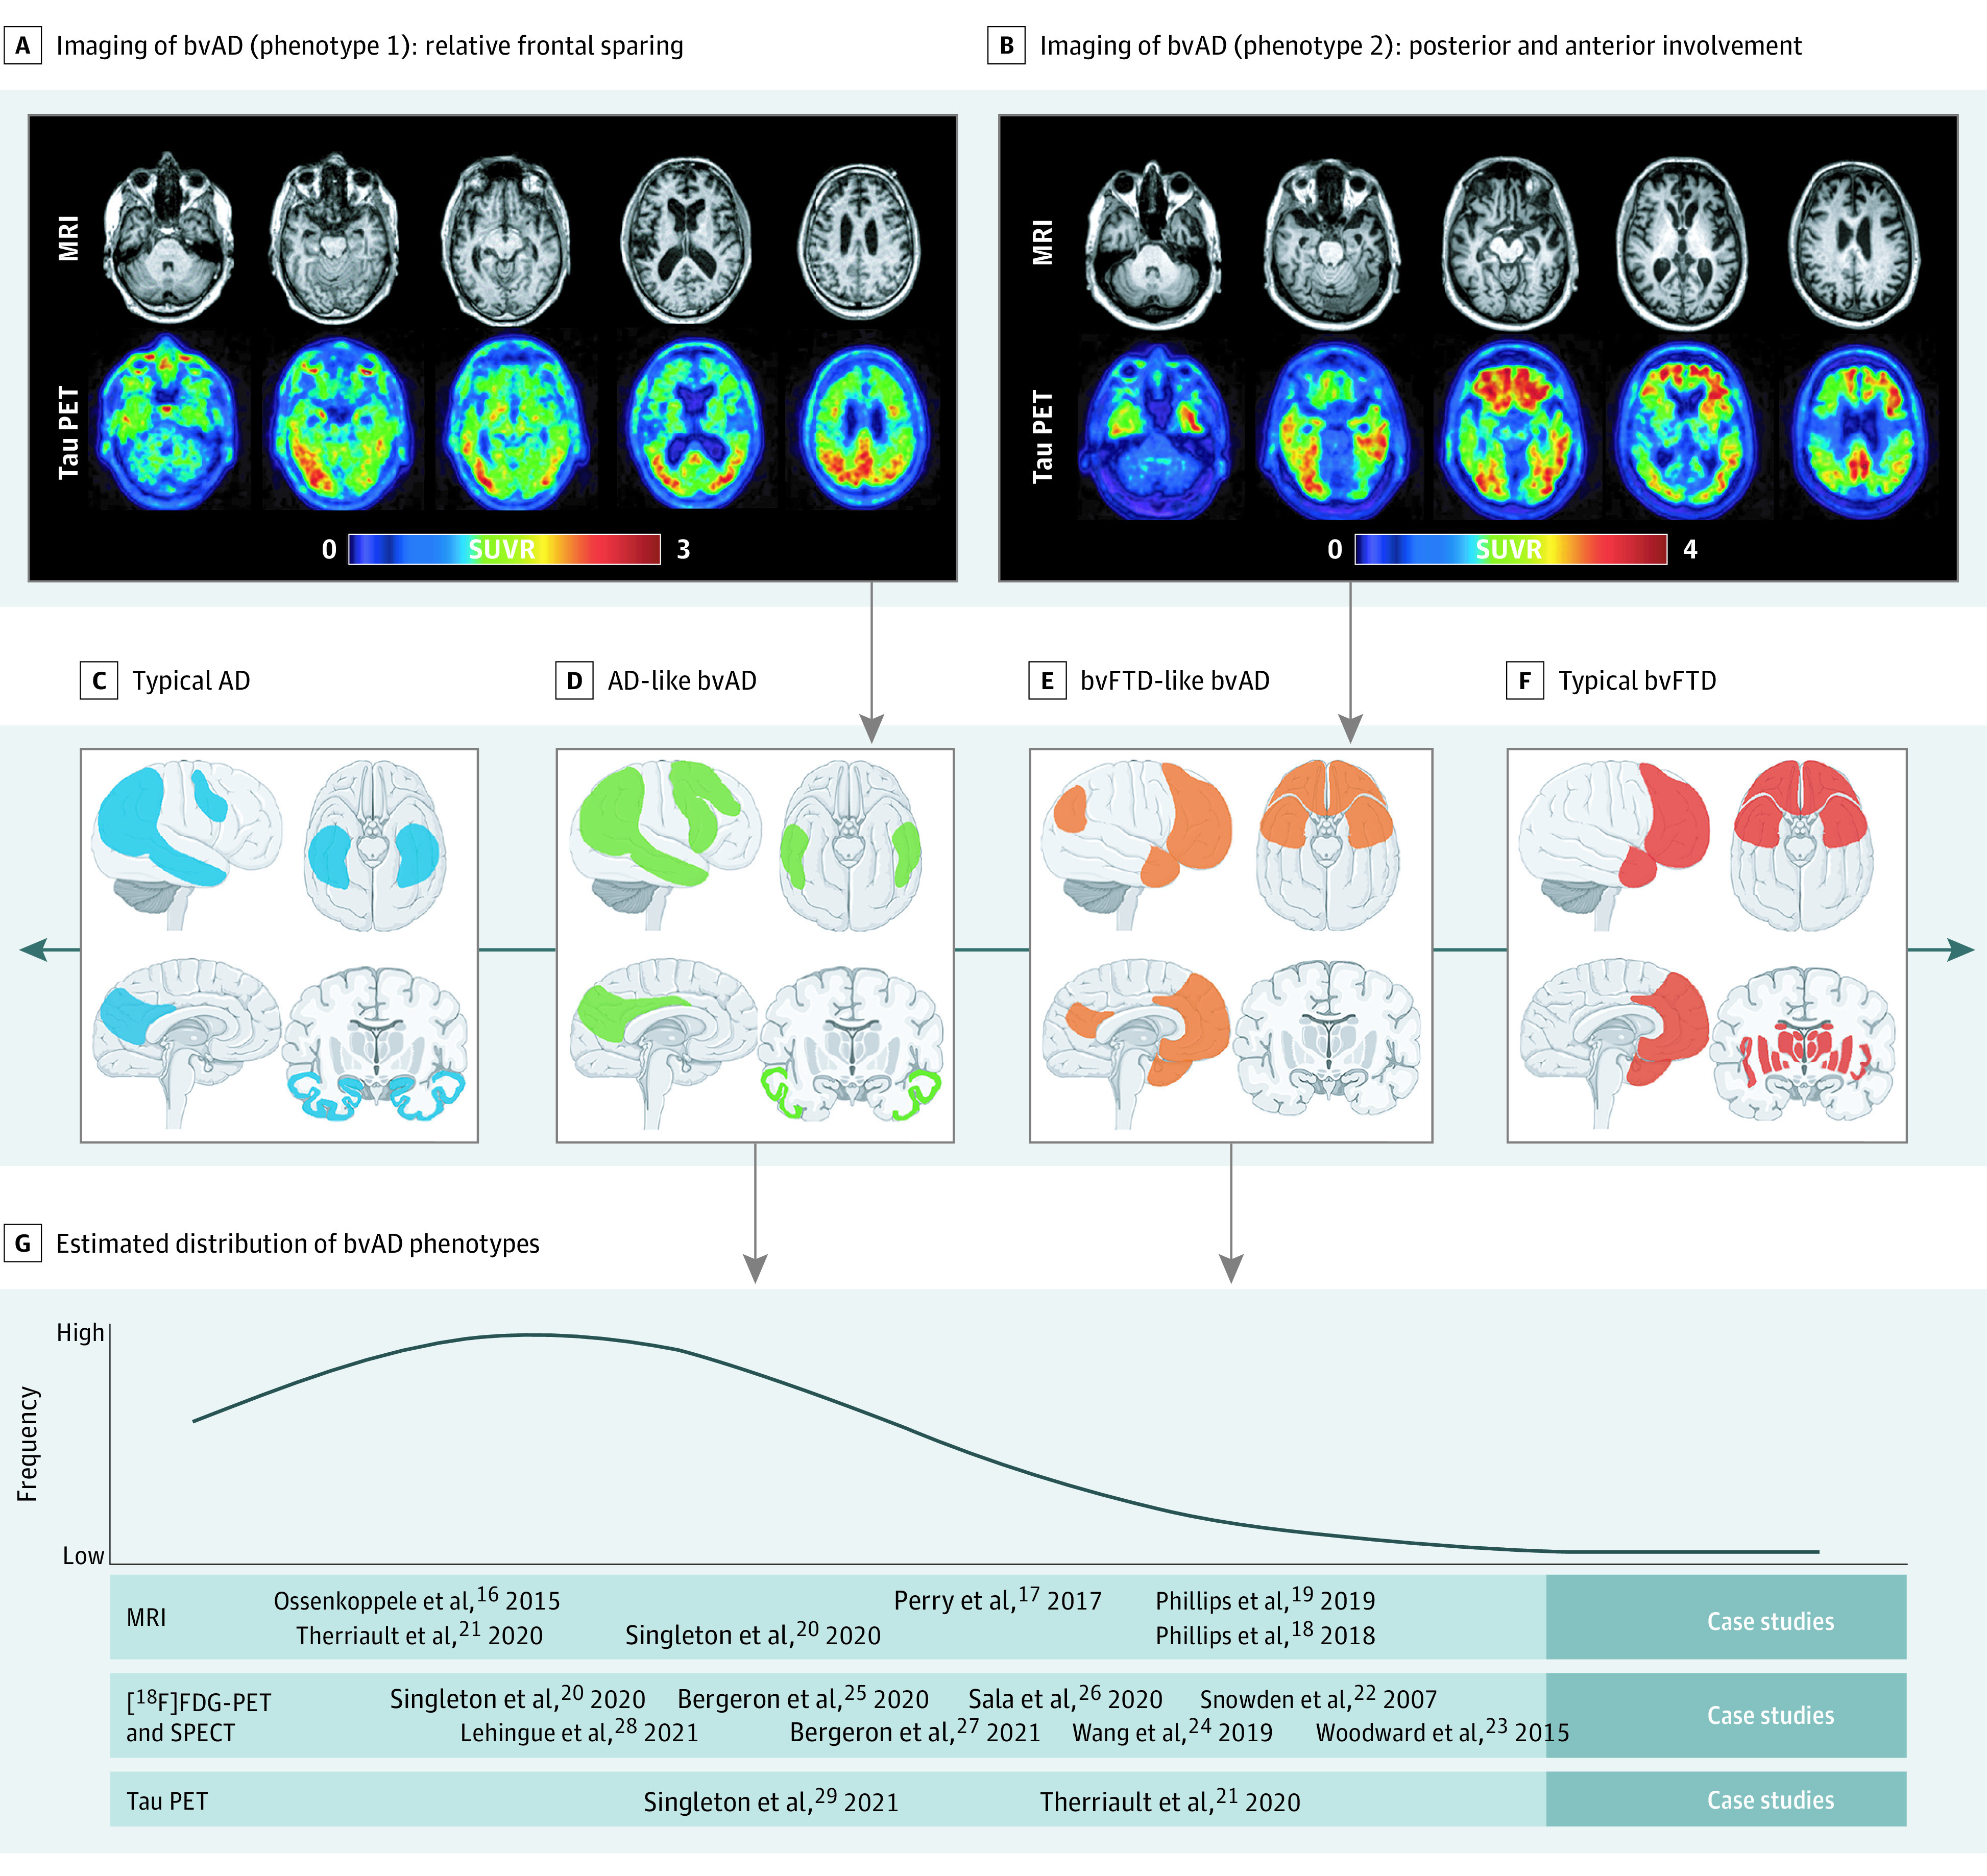
Figure 3. Neuroimaging Features in the Behavioral Variant of Alzheimer Disease (bvAD).

A and B, Two cases that serve as examples of 2 distinct bvAD neuroimaging phenotypes: an Alzheimer disease–like atrophy and tau load pattern with relative frontal sparing and a more behavioral variant of frontotemporal dementia (bvFTD)–like atrophy and tau load pattern with both posterior and anterior involvement. The tau positron emission tomography (PET) scans were performed using [18F]flortaucipir, and magnetic resonance imaging (MRI) was conducted on a 3-T scanner. C-F, Proposed neuroimaging phenotypes as part of a spectrum that ranges from a typical Alzheimer disease regional distribution to a classical bvFTD regional distribution. The brain template images were obtained from https://smart.servier.com/. G, Literature-informed estimated distribution of the regional distribution in bvAD, indicating that typical AD and bvAD-AD–like patterns are more common than bvAD-bvFTD–like and typical bvFTD. FDG indicates fluorodeoxyglucose; SPECT, single-photon emission computed tomography; SUVR, standardized uptake value ratio.
