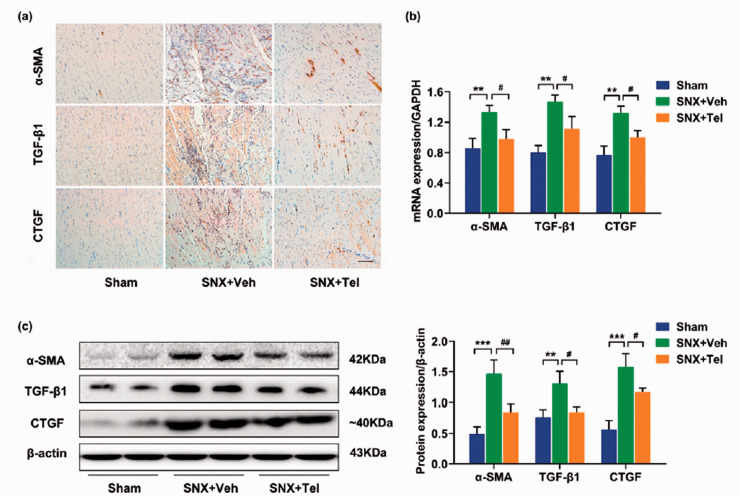
Figure 6.
Characterization of cardiac profibrotic cytokines expression in cardiorenal HFpEF. (a) Immunohistochemical staining of α-SMA, TGF-β1, and CTGF at week 16. (b) Real-time PCR and (c) western blot of α-SMA, TGF-β1, and CTGF in heart tissues and the calculated mean ± SD of protein/β-actin ratios. Scale bar in (a), 100 μm. *P < 0.05, **P < 0.01, ***P < 0.001 for SNX+Veh vs. Sham; #P < 0.05, ##P < 0.01, ###P < 0.001 for SNX+Veh vs. SNX+Tel. (A color version of this figure is available in the online journal.)

