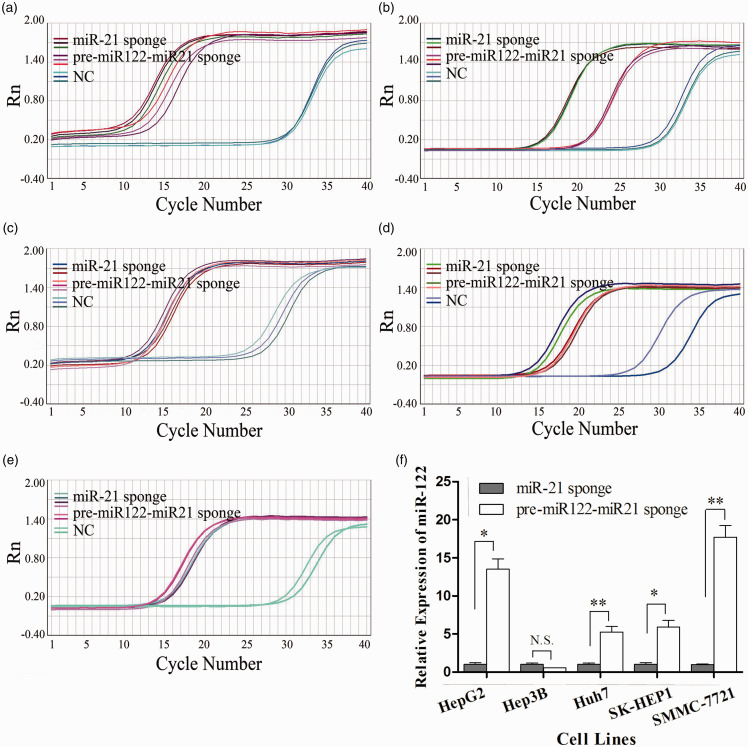
Figure 1.
Intracellular miR-21-sponge and miR-122 levels were detected by RT-qPCR. (a–e) The amplification curves of miR-21-sponge tested by RT-qPCR in the treatment and control groups of five HCC cell lines are shown. (a) HepG2, (b) Hep3B, (c) Huh7, (d) SMMC-7721, (e) SK-HEP1. (f) The relative expression of miR-122 in HCC cell lines is shown. (a) Each column represents an average of three independent experiments. *P < 0.05; **P < 0.01; N.S.: no significance. (A color version of this figure is available in the online journal.)

