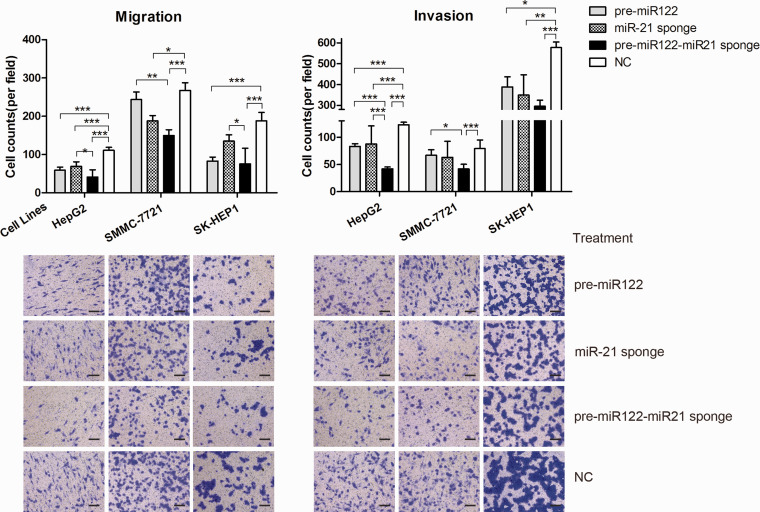
Figure 5.
The average number of cells passing through the transwell membrane is shown for migration and invasion assays when delivering the pre-miR122, miR-21-sponge, pre-miR122-miR-21-sponge, or NC sequence to HCC cell lines. *P < 0.05; **P < 0.01; ***P < 0.001. The error bar represents SE, which is calculated from 10 different fields of view in two independent experiments. One representative field of view for each group is attached in the corresponding column (scale bar, 200 μm). (A color version of this figure is available in the online journal.)

