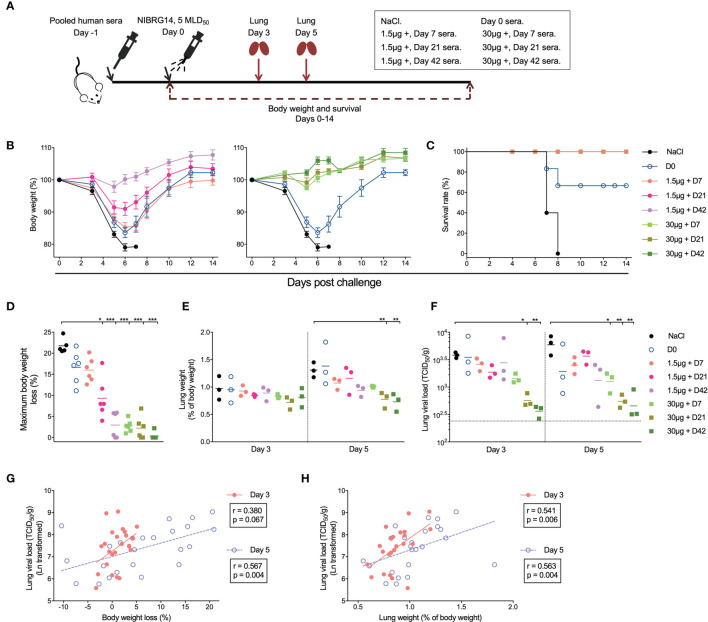
Figure 4.
Adjuvanted H5N1 vaccines elicit antibodies provided in vivo protection against lethal virus challenge. (A) Illustration of the experiment set-up for serum transfer and virus challenge. Pre-vaccination sera from subjects in 1.5μg + and 30μg + groups were pooled together as D0 sera. Sera from days 7, 21 and 42 after vaccination from subjects in 1.5μg + or 30μg + groups were pooled separately. Group-and time-point-wise pooled sera were administered intraperitoneally to female BALB/c mice (n=12 per group). NaCl was given as control. One day later, the mice were infected intranasally with 5× 50% mice lethal dose (MLD50) of NIBRG-14 virus. Body weight and survival were monitored for 14 days after challenge. Lungs from 3 mice per group were collected 3 and 5 days after infection for weight and viral load measurement. (B, C) The body weight loss (B) and survival rate (C) of the mice in different groups are shown. (D) Maximum body weight loss was calculated for each individual mouse as the maximum body weight loss through 14 days monitoring, which occurred at 5, 6 or 7 days after challenge. For mice with no body weight loss observed through monitoring, maximum weight loss was assigned as 0,01%. (E, F) The lung weight of the 3 mice sacrificed on days 3 and 5 after virus challenge was measured and is shown as the mean of percentage of pre-infection body weight (% of body weight, E). The viral load of NIBRG-14 virus was measured in MDCK cells as the reciprocal dilutions of lung homogenates that gave 50% tissue culture infection dose (TCID50) and standardized based on the lung weight (TCID50/g, F). The dotted line indicates the lowest detectable viral load in the assay. (G, H) The standardized lung viral load (TCID50/g) 3 and 5 days after infection correlate with the body weight loss (G) and the lung weight (H). The body weight of mice in each group is shown as mean ± standard deviation as error bar (B). Means (D, E) and geometric means (F) are shown as horizontal lines, and each symbol represents one mouse (D–H). *P < 0.05, **P < 0.01, ***P < 0.001 (lung viral load was Ln transformed in statistical analyses. False Discovery Rate controlled multiple comparisons between mice receiving NaCl and pooled sera were performed in Nonparametric Kruskal-Wallis test in D–F). The standardized lung viral load was Ln transformed in statistical analyses. Linear fitting curve is plotted as solid line (Day 3) or dotted line (Day 5) when nonparametric Spearman P < 0.10. Spearman r and P values are noted for each correlation (G, H). Duplicates were performed in lung weight and viral load measurement.

