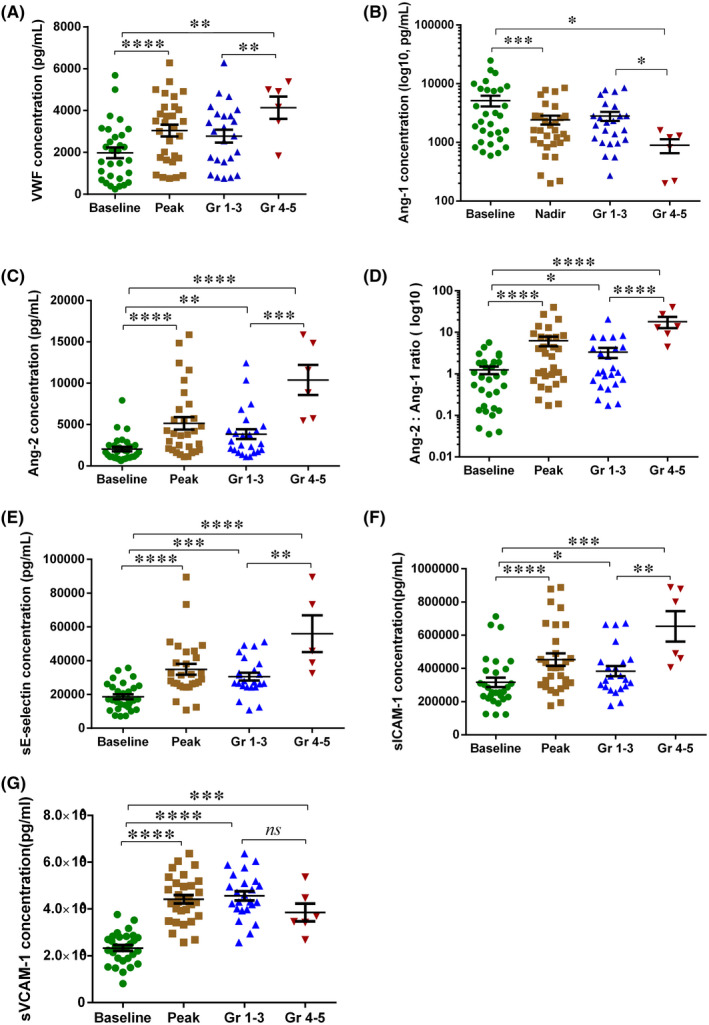
FIGURE 1.

Biomarkers of endothelial activation associated with the occurrence and severity of CRS. Serial assessment of 6 endothelial cell‐related biomarkers was performed in 30 patients treated with CD19‐targeted CAR‐T therapy. The baseline or peak/nadir values of biomarkers over the first month were depicted in Figure 1. VWF (A), Ang‐1 (B), Ang‐2 (Angiopoietin‐2, C), Ang‐2:Ang1 ratio (D), sE‐selectin (E), sICAM‐1(F) and sVCAM‐1(G) values collected approximately 30 days after CAR‐T cell infusion from total patients or a subset of patients with grades 1–3 (n = 24) or grades 4–5 (n = 6) CRS. VWF = von Willebrand factor, Ang‐1 = Angiopoietin‐1, Ang‐2 = Angiopoietin‐2, sICAM‐1 = soluble intercellular adhesion molecule‐1, sVCAM‐1 = soluble vascular cell adhesion molecule‐1. P values were determined using Student's t test for homogeneity of variance or Wilcoxon/Mann‐Whitney test for heterogeneity of variance. * p < 0.05, ** p < 0.01, **** < 0.001, **** p < 0.0001, ns means p < 0.05
