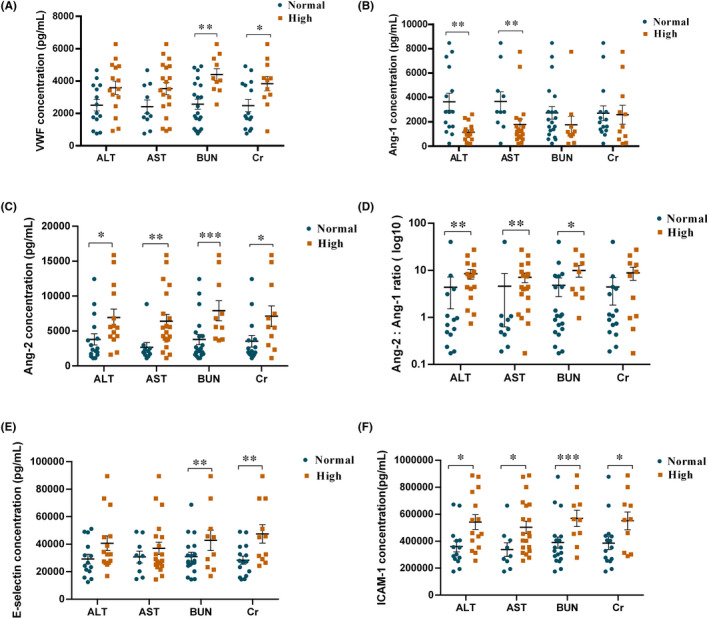
FIGURE 3.

The levels of endothelial activation biomarkers with the normal or high values of liver and kidney dysfunction parameters. Serum peak VWF (A), Ang‐1 (B), Ang‐2 (C), Ang‐2:Ang‐1 ratio (D), sE‐selectin (E), sICAM‐1 (F) in CRS patients with normal or elevated ALT (alanine aminotransferase), AST (aspartate aminotransferase), BUN (blood urea nitrogen) and Cr (creatinine) values. Mean ± SEM values are shown; P values were determined using Mann‐Whitney test, *p < 0.05, **p < 0.01,****<0.001,**** p < 0.0001
