
FIGURE 1.
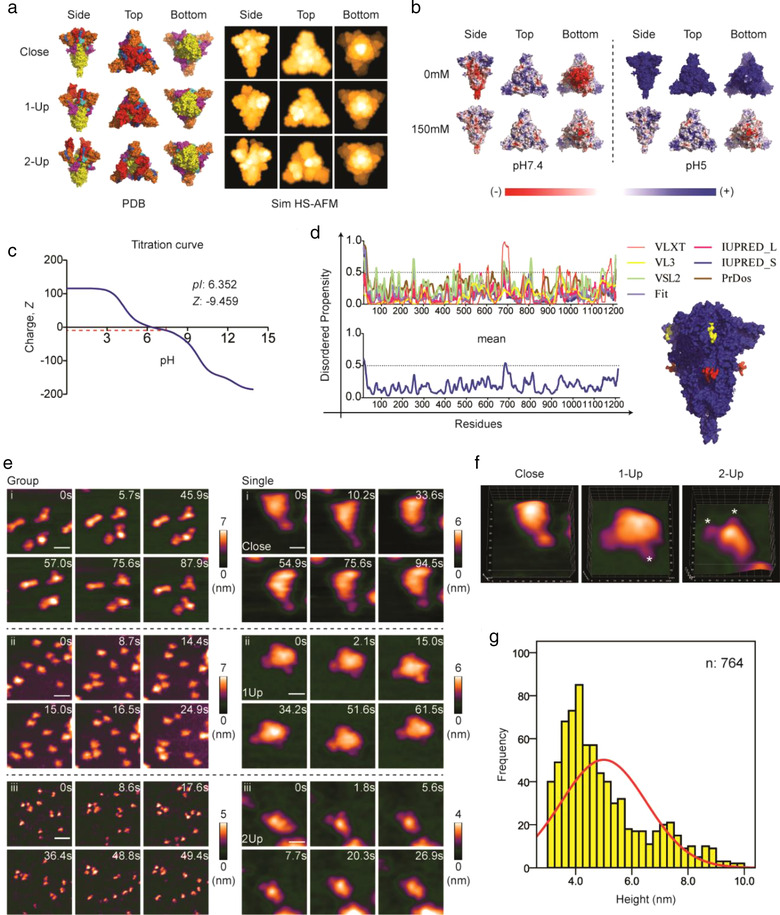
HS‐AFM reveals three distinct conformations of SARS‐CoV‐2 S proteins. (a) Cryo‐EM structures of S protein in close (PDB: 6XR8), 1‐Up (PDB: 6VSB), and 2‐Up (PDB: 7A93) conformations as shown in their 3D structures. An explanation of the colours used is available in Figure S1A. These 3D structures were used to simulate HS‐AFM images (Sim HS‐AFM). (b) PDB2PQR and APBS analysis of S protein were performed to generate surface electrostatic maps at different salt concentrations and pH. (c) Titration curve computed from the Prot pi website using S protein amino acid sequence. The isoelectric point and net charge at pH 7.4 are shown. (d) Prediction of intrinsic disorder region (IDR) predisposition in S protein. The predicted IDR regions are labelled in red and yellow as shown in a 3D structure of S protein. (e) HS‐AFM images showing a group or a single S protein at extracellular pH (scale bar, group, i: 25 nm, ii: 45 nm, iii: 60 nm; single, i: 12 nm, ii: 18 nm, iii: 20 nm). (f) 3D‐surface plot of the S protein in three distinct conformations (* indicates RBD). (g) Height histogram of the S protein