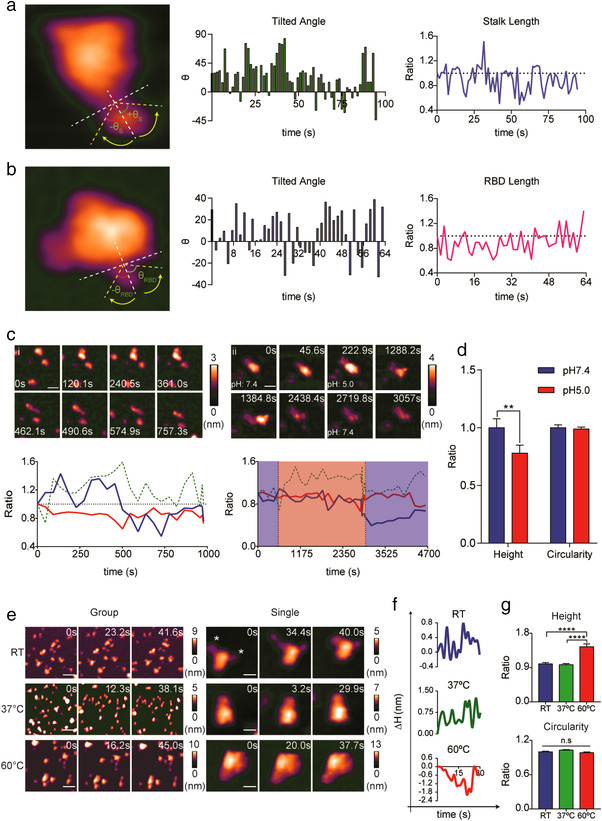
FIGURE 2.

Biophysical and morphological properties of the S protein. (a, b) HS‐AFM scanning revealed a flexible S stalk (a) and RBD (b). Real‐time tilted angle and length change are shown in bar graphs and line graphs respectively (length ratio: length t = n/length t = 0). (c) Dissociation of the S head (i and ii) and elongation of the S stalk (i) upon acidification (scale bar, i: 30 nm, ii: 25 nm). Real‐time ratio changes in height (h t = n/h t = 0), area (A t = n/A t = 0), and circularity (C t = n / C t = 0) were calculated and are illustrated in line graphs (blue: height, green dotted: area, red: circularity; blue area: pH 7.4, red area: pH5). (d) Low pH induced significant reduction in S protein height. Data are presented as the mean ratio ± SEM of height before and after acidification, analysed by Wilcoxon Signed‐Rank test (n: 21; p = 0.0057, **p < 0.01). (e) Topology of S protein after exposed to different temperatures (scale bar, group, RT: 60 nm, 37°C: 75 nm, 60°C: 60 nm; single: RT and 37°C: 15 nm, 60°C: 20 nm). (f) Real‐time height changes (Δ h = h t = n ˗ h t = 0) in the S protein exposed to different temperatures. (g) High temperatures significantly increased the height of the S protein. Both height and circularity values are expressed in ratios relative to the samples treated at RT. Data are presented as the mean ratio ± SEM (n, RT: 94, 37°C: 80, 60°C: 104; ****p < 0.0001, ns: no statistically significant)
