
FIGURE 3.
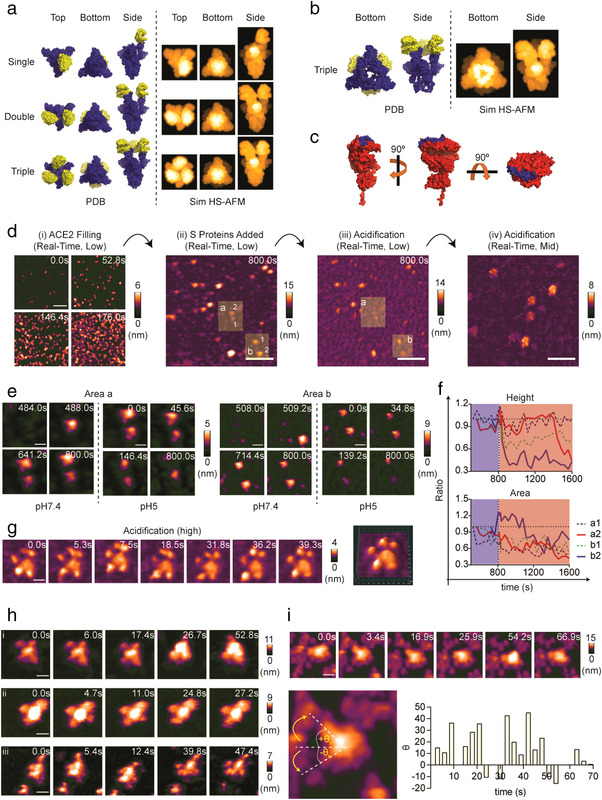
Conformational dynamics of the S protein when interacting with monomeric ACE2. (a) Cryo‐EM structures of single‐ (PDB: 7A94), double‐ (PDB: 7A97), and triple‐ACE2 (PDB: 7A98)‐bound S proteins are illustrated as molecular surface diagrams (blue: S protein; yellow: monomeric ACE2). These structures were used to simulate their respective HS‐AFM images. (b) Cryo‐EM structure of the triple‐ACE2‐bound S protein (PDB: 7A98) was edited by removing the S2 subunit to simulate the HS‐AFM image of the triple‐ACE2‐bound S1 subunit. (c) Cryo‐EM structure of the monomeric ACE2 ectodomain (PDB: 6M18) is depicted in the molecular surface diagram. The blue region indicates the binding site of RBD of S protein. (d) Real‐time observation of the S protein–ACE2 interaction. HS‐AFM observations were started at low magnification with ACE2 filling on the nickel (Ni2+)‐coated mica. Extra ACE2 was removed, followed by the addition of S protein. Real‐time interactions between S protein and ACE2 at pH 7.4 were observed for 800 s, followed by acidification for another 800 s. Then, multiple sites were screened at mid magnification for the S protein–ACE2 complex under acidic conditions (scale bar, i: 150 nm, ii and iii: 250 nm, and iv: 125 nm). (e) Two areas (a and b) cropped from the figures in d(ii) and d(iii) delineated the real‐time conformational dynamics of S protein during interaction with ACE2 from neutral to acidic conditions (scale bar, Area a: 30 nm; Area b: 60 nm). (f) Real‐time height and area changes in the S protein in E were measured and are presented as ratios relative to their respective initial height (ht = 0) and area (At = 0). The results showed rapid declination in height and area upon acidification (blue area: pH 7.4, red area: pH 5). (g) S protein–ACE2 conformation after acidification for 800 s as shown by high magnification HS‐AFM scanning (scale bar: 13 nm). (h) HS‐AFM images of the S protein–ACE2 complex after incubation of S protein and ACE2 for 30 min at room temperature (scale bar, i: 25 nm; ii: 38 nm; iii: 25 nm). (i) HS‐AFM observation revealed the ACE2‐bound S protein with a dynamic S stalk (scale bar: 30 nm). Tilted angles were measured and are plotted in a bar graph