
FIGURE 2.
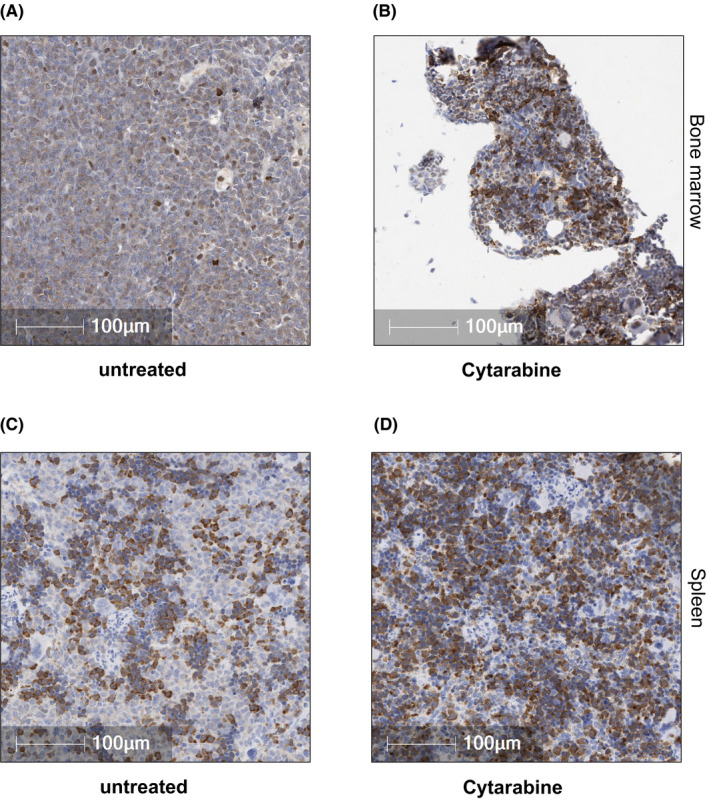
CA IX and/or CA XII is expressed in Cytarabine‐residual FLT3/ITD+ AML cells in vivo. (A) Representative tissue sections from untreated animals showed BM hypercellularity with collapse of the vascular channels, occasional small foci of normal erythroid and myeloid cells as well as few megakaryocytes. The vast majority of cells seen in the marrow consisted of large myeloid blasts filling most of the marrow space. The immunostaining for CA IX was multi‐focal and localised on the cell membrane. (B) Treatment of M14 xenografts with Cytarabine (12.5 mg/kg BW) for 5 days led to a reduction in the leukemic burden with enhanced CA IX staining in blasts remaining after treatment with Cytarabine. (C) In untreated animals, the spleen showed marked expansion of the red pulp with large, myeloid blasts replacing most of the normal architecture. (D) In Cytarabine treatment animals, less leukemic blasts were observed in the red pulp compared to the untreated group. Similar to the findings in the BM, CA IX staining was multi‐focal and enhanced in blasts remaining after treatment with Cytarabine. The Positive Pixel Count algorithm on Aperio ImageScope (Leica Biosystems) was used to quantify the amount of CA IX and CA XII staining present in a scanned slide image. A range of colour (range of hues and saturation) and three intensity ranges (weak, positive and strong) were masked and evaluated. The analysis specific to this project required the exclusion of macrophages in the field of analysis. Macrophages stain intensely with CA‐IX and CA‐XII and were therefore excluded from the analysis. An FDA‐approved algorithm was used to distinguish between brown and blue pixels. Corresponding H&E stained sections from the BM and spleen are shown in Figure S2A–D