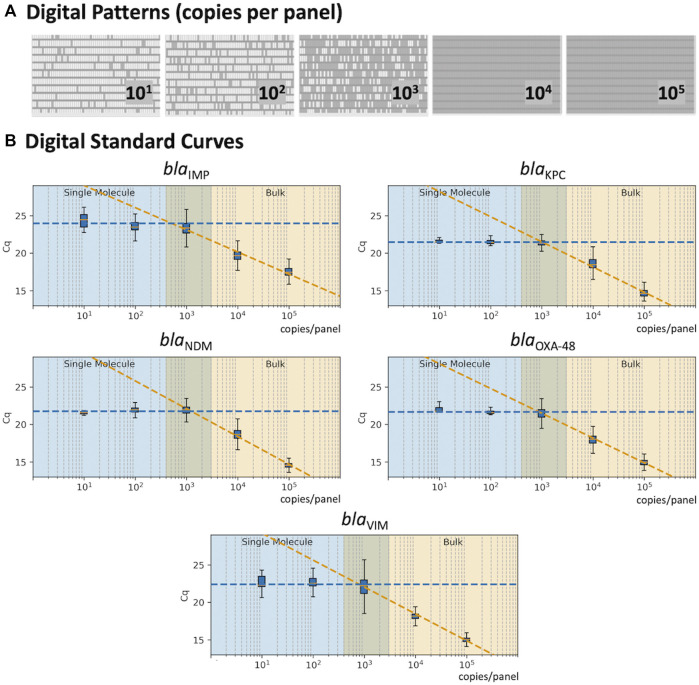
FIGURE 2.
Standard Curve in real-time digital PCR. (A) Digital patterns for each microfluidic panel at increasing concentrations (770 reaction chambers per panel; 0.85 nL volume per chamber). (B) Standard curves correlating the Cq values with the concentration of each target; shaded blue area indicates the single-molecule region; shaded orange shows the bulk region; and the middle area displays the theoretical transition between the single-molecule and bulk.

