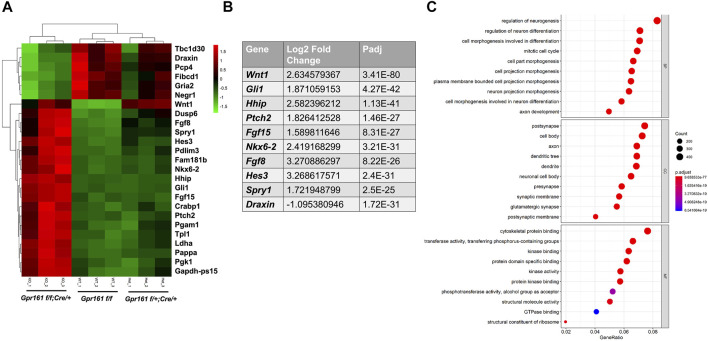
FIGURE 4.
The transcriptomic analysis of the midbrains of Gpr161 cKO fetuses at E13.5. (A) The Heat map from dissected midbrain tissues of Gpr161 f/f (floxed control), Gpr161 f/+ ;Wnt1-Cre/+ (Cre control) and Gpr161 f/f ;Wnt1-Cre/+ (cKO) fetuses at E13.5 (n = 3). Top 25 DEGs were displayed in Heat map (Top 6 downregulated genes in Green in cKO and top 19 upregulated genes in Red in cKO). (B) Top ten differentially regulated genes (DEGs) in Gpr161 cKO (C) Gene Ontology (GO) analysis of DEGs in Gpr161 cKO.

