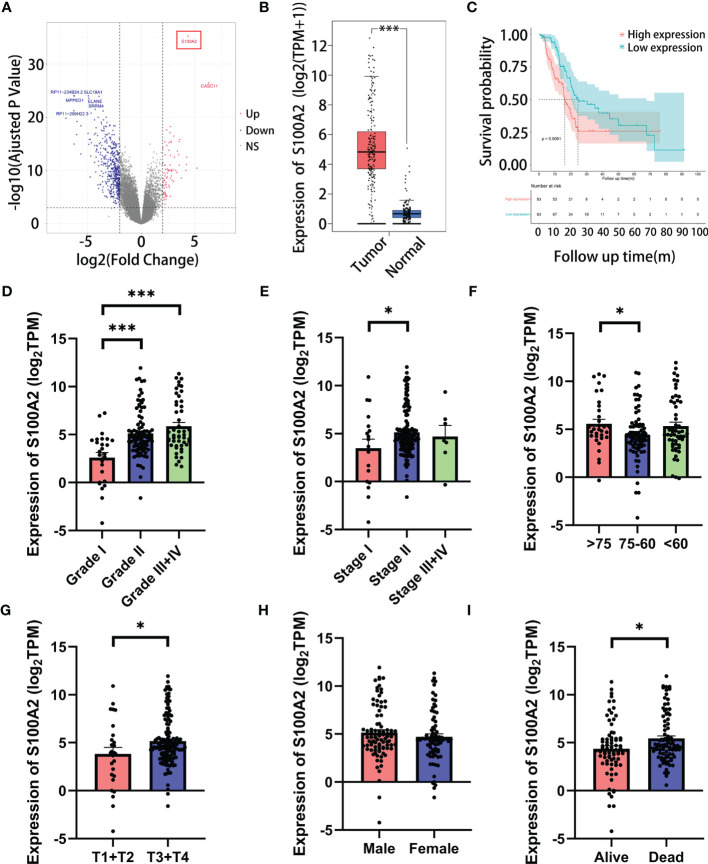
Figure 4.
The correlation of the expression of S100A2 and clinicopathological features of PC patients in TCGA entire set. (A) Screening out the most paramount gene in risk signature by DEGs analysis between high and low risk groups (the gene in red box). (B) Expression difference of S100A2 between PC tissue and normal tissue according to the cBioPortal database. (C) Kaplan-Meier analysis of OS between the high S100A2 expression group and low S100A2 expression group. (D–I) The correlation of S100A2 expression with clinicopathological features, including grade, AJCC_stage, age, T stage, N stage and status. *P < 0.05; ***P<0.001.

