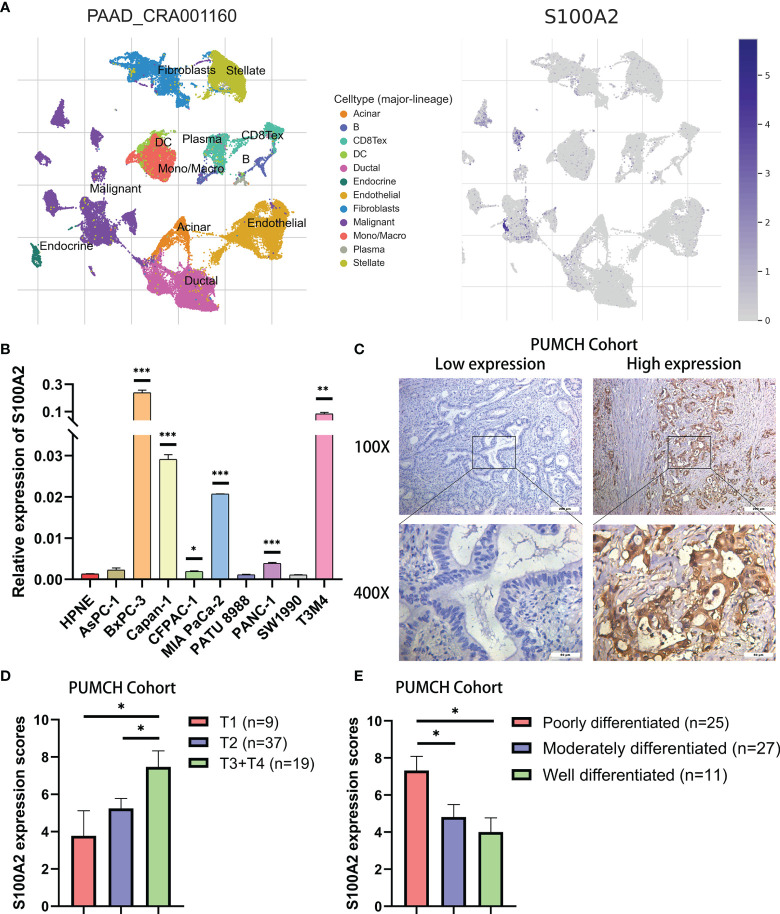
Figure 5.
Validation of high expression of S100A2 in PC cancer cells and its association with poor prognosis. (A) The results of clustering and S100A2 expression distribution in single cell dataset CRA001160. (B) The expression difference of S100A2 between normal and pancreatic cancer cell lines detected by qRT-PCR. The difference between each PC cell line and HPNE was analyzed. (C) Representative images of low and high expression of S100A2 in PUMCH cohort (n = 65). (D–E) Correlation between S100A expression and T stage and differentiation status in PUMCH cohort. *P < 0.05; **P < 0.01; ***P < 0.001.

