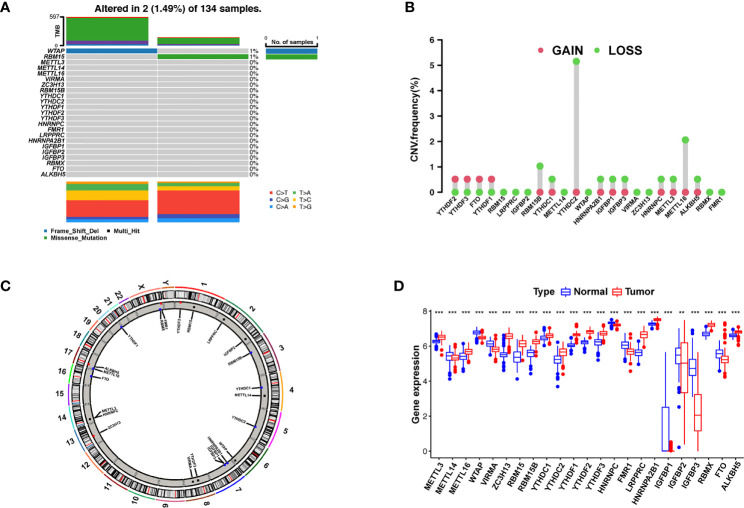
Figure 1.
Landscape of gene and expression changes of m6A modulators in AML. (A) The mutational frequency of 23 m6A modulators in 134 patients with AML from the TCGA-AML cohort. Each column reflects a single patient. The bar plot above presents TMB. The figure on the right reflects the mutational frequency of each modulator. The bar plot on the right presents the level of each variation type. (B) The copy number variant (CNV) change frequency of the m6A regulators from the GSE71014 cohort. The column height reflects the change frequency. Deletion frequency = green point; magnification frequency = red point. (C) The site of CNV change of the m6A regulators on 23 chromosomes from the GSE71014 cohort. (D) The expression of 23 m6A regulators between healthy and tumor samples. Cancer = red; healthy = blue. The upper and lower ends of the boxes reflect the quartile deviation of the data. The lines in the boxes reflect the midvalue, and the black points denote outliers. The asterisks reflect the statistical p result (** p < 0.01; *** p < 0.001).

