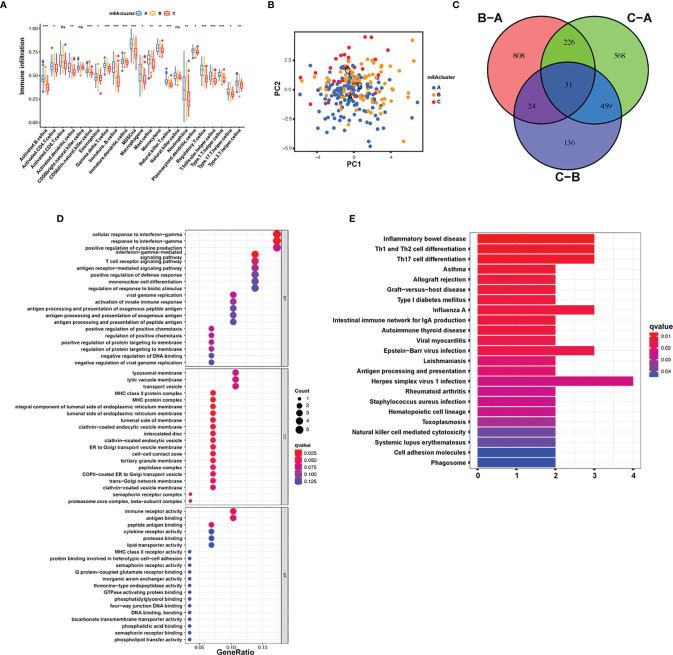
Figure 3.
TME cellular infiltration and transcription of different m6A modification patterns. (A) The abundance of each TME infiltration cell type in the three m6A modification patterns. The upper and lower ends of the boxes represent the quartile deviation of the data. The lines in the boxes represent the midvalue, and the black points represent the outliers. The asterisks denote the statistical p-value (* p < 0.05; ** p < 0.01; *** p < 0.001; ns, non-significant). (B) PCA for the transcriptomic profiles of the three m6A modification patterns, displaying evident diversity in the transcription between different modification patterns. (C) The 31 m6A phenotype-associated genes presented in a Venn illustration. (D, E) Functional annotation of m6A-associated genes via GO and KEGG enrichment assays. The color depth of the barplots denotes the quantity of enriched genes.

