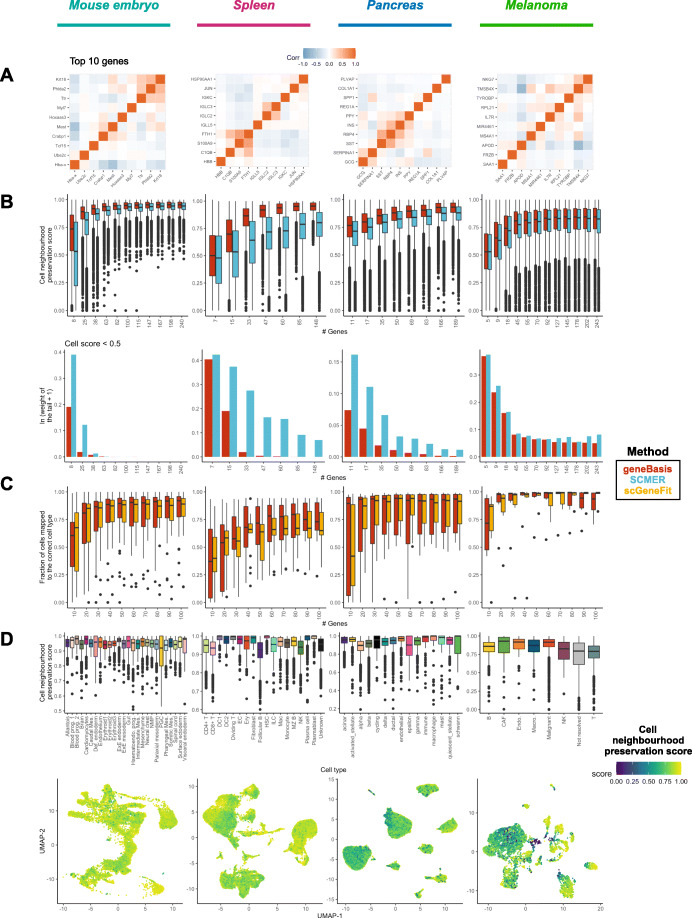
Fig. 2.
geneBasis preserves local and global structure. Each column represents the results for a different biological system. A Co-expression within top 10 selected by geneBasis genes. B Upper panel: The overall convergence of cell neighborhood preservation distributions for geneBasis (in red) and SCMER (in blue) as a function of the number of selected genes. Lower panel: the weight of tails of the distributions (i.e., fraction of cells with neighborhood preservation score < 0.5). Values are rescaled as ln(x + 1). C The fraction of cells mapped to the correct cell type for geneBasis (in red) and scGeneFit (in orange) as a function of number of genes in the selection. D Upper panel: The distribution of neighborhood preservation scores (calculated for the first 150 genes) per cell type. Lower panel: UMAP representation colored by neighborhood preservation score (calculated for the first 150 genes). UMAP coordinates themselves were calculated using the whole transcriptome. For visualization purposes, cell neighborhood preservation scores lower than 0 were set equal to 0

