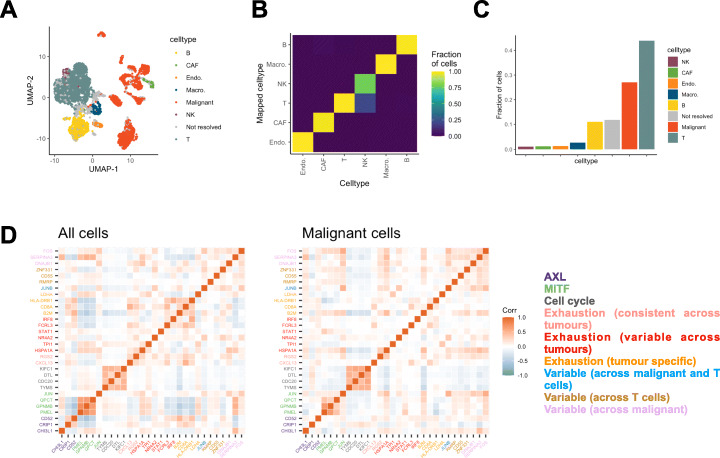
Fig. 5.
geneBasis identifies cell state genes relevant for heterogeneity across multiple cell types in the context of cancer. A UMAP representation, colored by malignancy status and annotated cell types. UMAP coordinates themselves were calculated using the whole transcriptome. B Cell type confusion matrix for non-malignant cells. C Ordered barplot for cell type abundance. D Co-expression (within all cells, left panel; within malignant cells, right panel) for selected genes associated with various transcriptional programs identified in the original publication. Colors correspond to detected programs, corresponding legend is on the right

