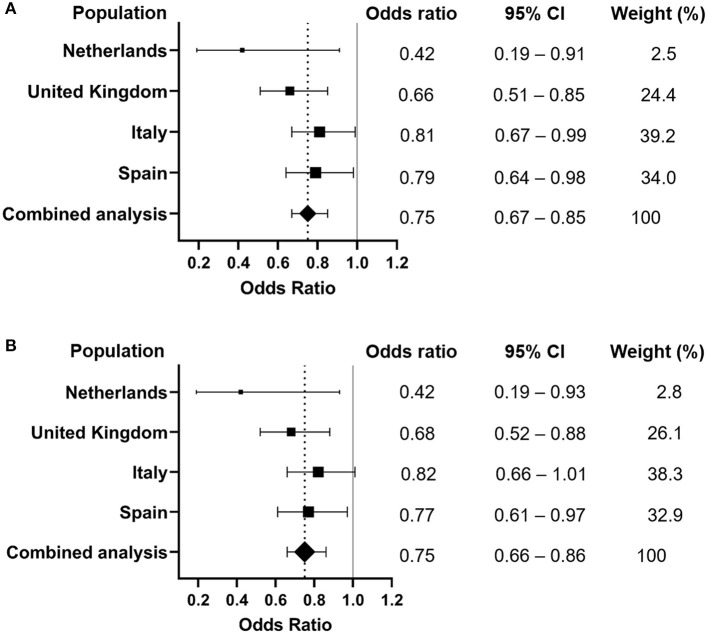
Figure 1.
Forest plots of meta-analyses of the association of MUC5B rs35705950 with severe COVID-19 in subjects of European ancestry. Dotted line represents the odds ratio from the combined analysis. (A) Meta-analysis of allele contrast (T vs. G; P combined analysis = 6.63 e-06). (B) Meta-analysis of the dominant T-allele carriage model (GT+TT vs. GG; P combined analysis = 2.05e-05). CI, confidence interval.

