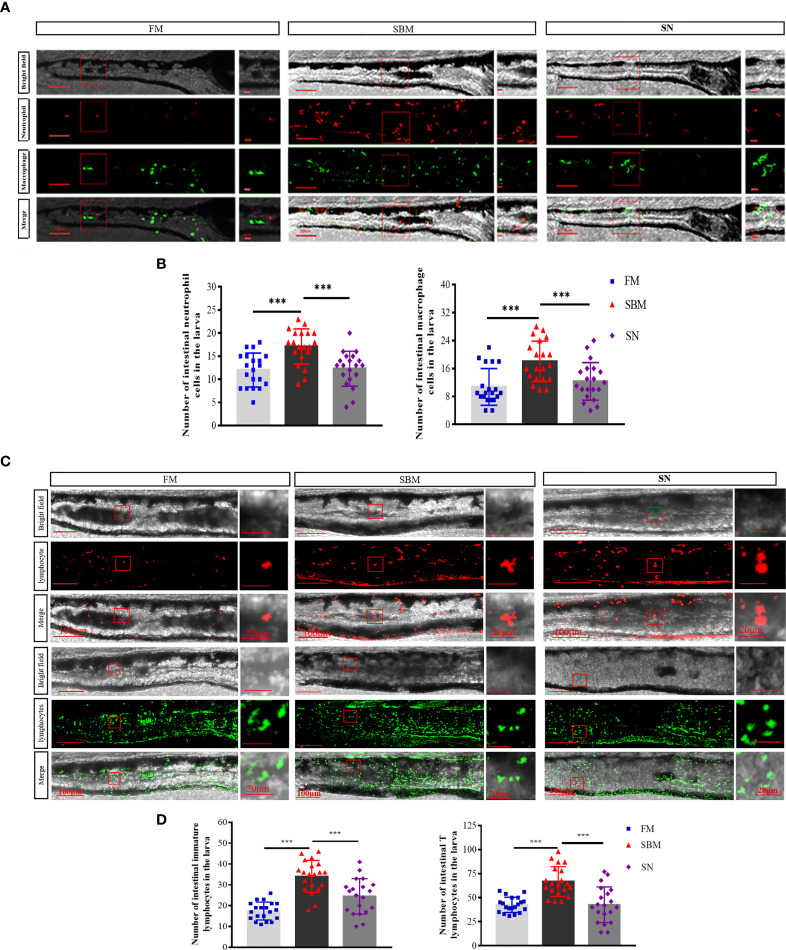
Figure 5.
Imaging analysis of immune cells in the hindgut of the zebrafish SBMIE larva model. (A) Hindgut innate immune cells, including neutrophils (lyz-DsRed labeled cells) and macrophages (mpeg-EGFP labeled cells); (B) the histogram of lyz or mpeg signals in the hindgut of larva. (C) Hindgut adaptive immune cells, including immature lymphocytes (rag2-DsRed-labeled red cells) and mature T lymphocytes (lck-EGFP-labeled green cells). (D) The histogram of rag2+ or lck + signals in the hindgut of larva. FM, fish meal diet; SBM, soybean meal diet; SN, sinomenine (35 ppm) supplementary SBM diet. The significant differences were indicated by p value, and *** represented p < 0.001. The scale bar in whole hindgut pictures was 100 μm, while the scale bar in the enlarged view was 20 μm.

