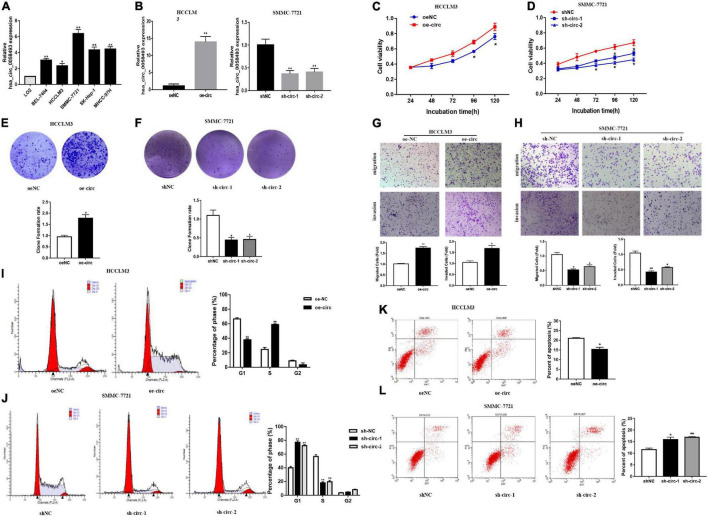
FIGURE 2.
(A) The expression of hsa_circ_0058493 in BEL-7404, HCCLM3, SMMC-7721, SK-Hep-1, MHCC-97H, and LO2 cells was detected by qRT–PCR assays. (B) The efficiency of transfecting the knockout plasmid and overexpression plasmid of hsa_circ_0058493 into HCC cells by qRT-PCR. (C,D) The CCK-8 test was used to analyze the proliferation of HCC cells with overexpression and knockdown of hsa_circ_0058493 (oe-circ and sh-circ-1, sh-circ-2). (E,F) Cloning experiments were tested to analyze the effect of oe-circ and sh-circ-1, sh-circ-2 on the proliferation of HCC cells. The colony formation rate was shown by a histogram. (G,H) The migration and invasion ability of HCC cells with oe-circ and sh-circ-1, sh-circ-2 was tested by the Transwell assay. The number of migrating and invading cells was counted. (I,J) Cell cycle assays were analyzed by flow cytometry. The histogram showed that hsa_circ_0058493 knockdown cells stagnated in G1 phase and that hsa_circ_0058493-overexpressing cells promoted cell proliferation. The triangle symbols are for discrimination of G1 vs. S and S vs. G2. (K,L) Apoptosis was detected by flow cytometry. The assay proved that the number of apoptotic cells detected in the samples transfected with the overexpression of hsa_circ_0058493 (oe-circ) was small, while the samples transfected with knockdown of hsa_circ_0058493 (sh-circ-1, sh-circ-2) had more apoptotic cells. *P < 0.05, **P < 0.01 vs. control group.

