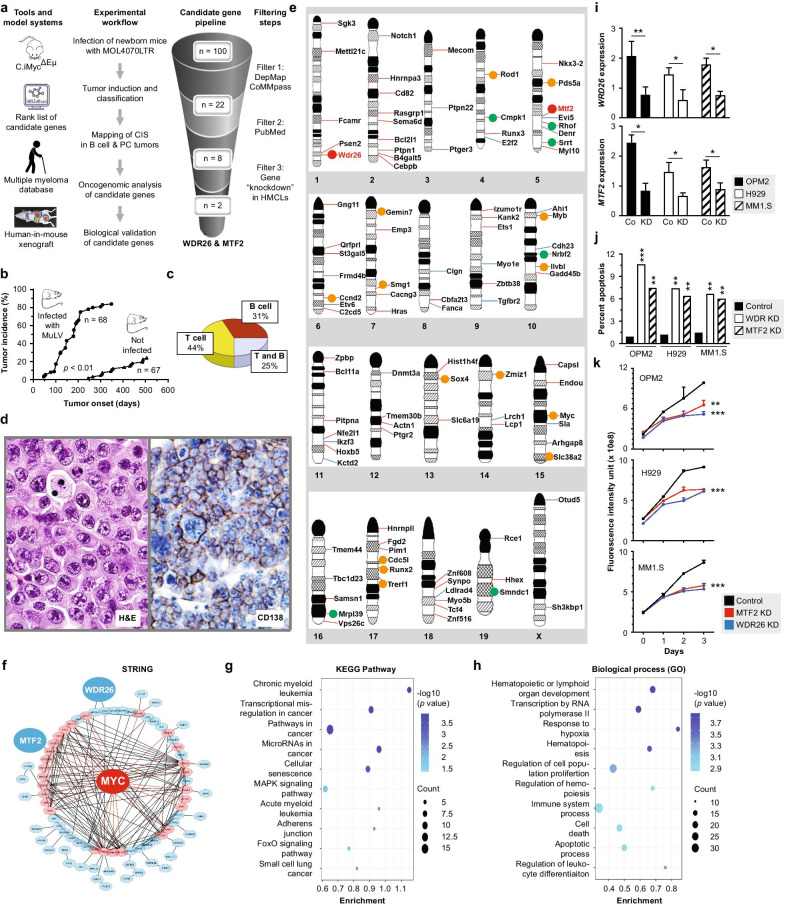
Fig. 1.
Discovery of WDR26 and MTF2 in unbiased genetic forward screen using Myc-transgenic mice. a Schema of workflow that led to the nomination of WDR26 and MTF2 as candidate myeloma genes. Filters used to pare down the list of 100 input genes to 2 candidate genes are indicated on the right. b Accelerated tumor development in iMycΔEµ gene-insertion mice treated with MOL4070LTR (mean tumor onset 178 ± 94 days; range 46–348 days) compared to mice not infected with virus (mean tumor onset 384 ± 86 days; range 245–505 days). Virus was injected IP (5 × 10⁴ colony forming units/10 µL) using a 30-gauge needle. c Tumor pattern in virus-infected mice from b. d Tissue section of plasmacytoma (left) and B lymphoma exhibiting plasmablastic differentiation (right) stained according to hematoxylin and eosin (H&E) and immunostained using antibody to CD138, respectively. e Ideogrammatic representation of mouse autosomes plus chromosome X indicating the genomic location of the top 100 candidate B cell and plasma cell tumor genes detected. Genes that passed Filters 1, 2 and 3 in a are labeled using orange, green and red dots, respectively. Thin red or blue lines denote whether cRIS mapping predicts increased or decreased gene expression due to proviral insertion. f Network of MYC-interacting proteins visualized by STRING (Search Tool for the Retrival of Interacting Genes). Proteins (n = 27) that interact with MYC directly or indirectly are depicted in red or blue, respectively. The minimum required interaction score was 0.5. Red and black lines within the network circle denote direct and indirect interactions with MYC, respectively. The symbols for WDR26 and MTF2 are enlarged for enhanced visibility. Network visualization relied on Cytoscape 3.8.2. g KEGG (Kyoto Encyclopedia of Genes and Genomes) pathway analysis of the top 100 candidate genes. Enrichment scores are denoted by ovals which indicate both the number of pathway genes involved (count) and level of statistical significance (blue saturation). h GO (Gene Ontology) term enrichment analysis of biological processes using the top 100 candidate genes from a as input. i Magnitude of RNAi-dependent knockdown (KD) of WDR26 and MTF2 expression in three different HMCLs relative to HMCLs transfected with scrambled message (control). j Programmed cell death in HMCLs exhibiting low WDR26 or MTF2 expression (KD) compared to HMCLs cells containing normal message levels (control). Gene knockdown relied on Sigma MISSION® Endoribonuclease-prepared siRNAs (esiRNAs, 50 ng), a heterogeneous mix of siRNAs that target the same message. k Growth inhibition (PrestoBlue™) of HMCLs harboring low levels of WDR26 or MTF2 message. Genes were knocked down using Mission EHU esiRNAs 150,671 (WDR26) and 042,951 (MTF2)

