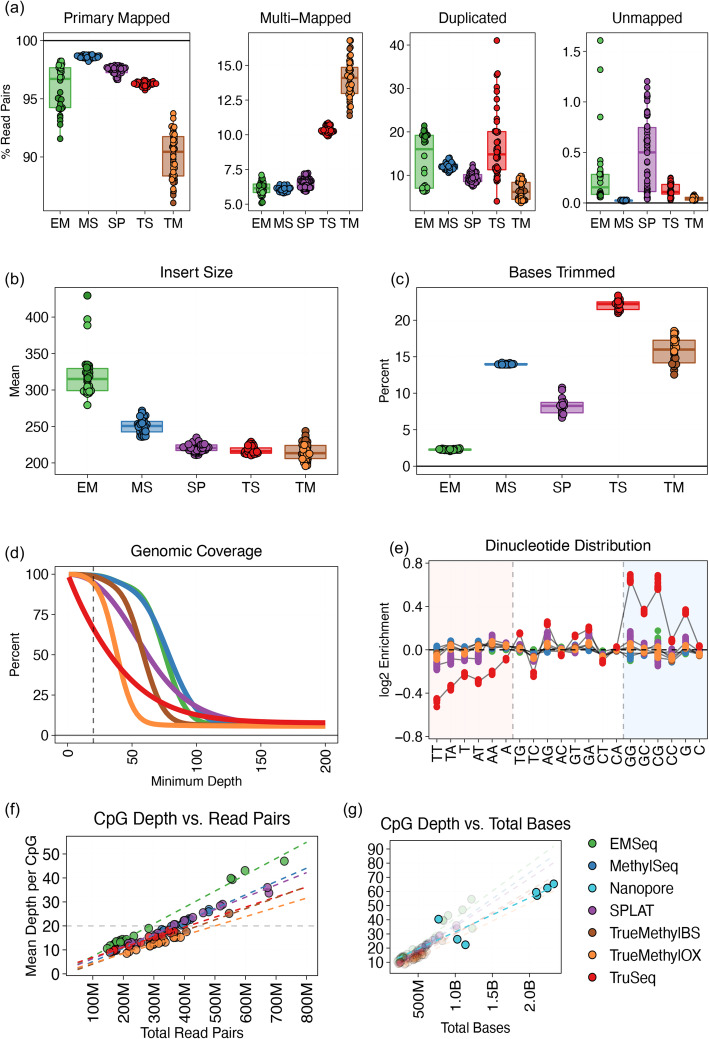
Fig. 1.
Sequencing and alignment metrics of whole methylome libraries, including all replicates across all cell lines. EM = EMSeq; MS = MethylSeq; SP=SPLAT; TS = TruSeq; TM = TrueMethyl. a Distribution of reference-based read alignment outcomes, including primary mapped reads (both mates mapped in correct orientation within a certain distance), multi-mapped reads (read pairs containing secondary or supplementary alignments), reads marked as PCR or optical duplicates, and unmapped reads. Ambiguous and duplicate reads can be a subset of properly aligned reads. b Median insert size distributions derived from distance between aligned paired end reads. c Percentage of bases trimmed per replicate, either due to low base quality, adapter content, or dovetailing reads. d Cumulative genomic coverage plot, averaged across cell line per assay. Coverage is cut off at 200× in this plot, but extends beyond for all assays. Dotted line indicates 20× mean coverage. e Nucleotide bias plot showing the log2 enrichment of covered versus expected mono- and di-nucleotides. f The relationship between the number of read pairs sequenced per assay and the mean depth of coverage per CpG dinucleotide, showing sequencing depth required to achieve a certain level of coverage. 20× CpG coverage is shown as the dotted line. g Same as f, but plotted using total bases sequenced, to include Oxford Nanopore sequencing, which produces variable read lengths

