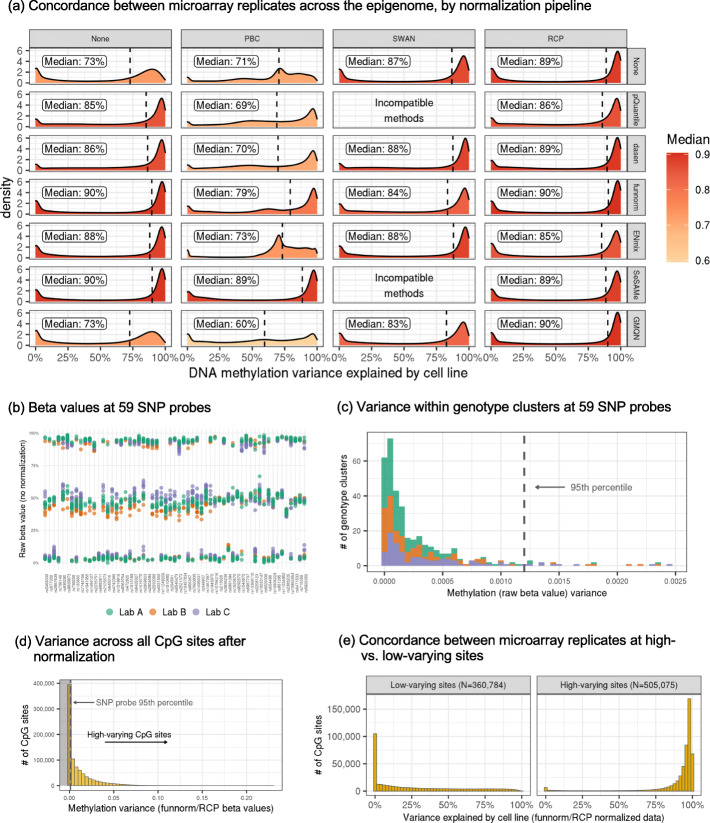
Fig. 5.
Microarray normalization and low-varying site definition. a Densities showing the percentage of DNA methylation variation explained by cell line across the epigenome (N = 677,520 overlapping CpG sites) for each normalization method. b Raw beta values at each of the 59 SNP probes on the Illumina EPIC arrays, with samples colored by lab. c Variance in methylation beta values (no normalization) within each genotype cluster at the 59 SNP probes, separated and colored by lab. The dotted vertical line represents the 95th percentile. d Variance in methylation beta values (normalized with funnorm + RCP) across the epigenome. Sites in the shaded area, which have less variation than 95% of SNP probe genotype clusters, are defined as low-varying sites. e Percentage of methylation (normalized with funnorm + RCP) variance explained by cell line across the epigenome, stratified by high-varying vs. low-varying sites

