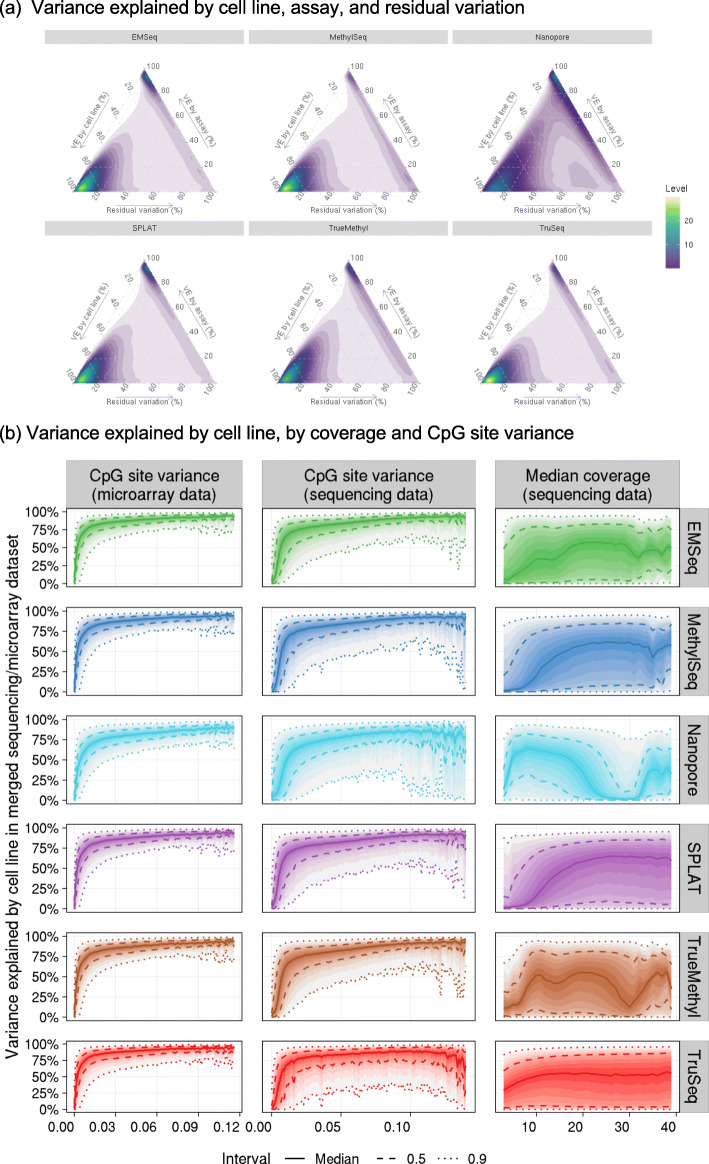
Fig. 6.
a Density plots of sequencing/microarray concordance indicating the percent of variance explained (VE) by cell line, assay (sequencing or microarray), and residual variation for 841,833 CpG sites with complete information in all assays. b Distribution of percent variance explained by cell line in the sequencing/microarray variance partition analysis as a function of beta value variance (binwidth = 0.001) and median coverage (binwidth = 1) at each CpG site. 90% of the y-axis values fall between the outermost dotted lines for each bin along the x-axis

