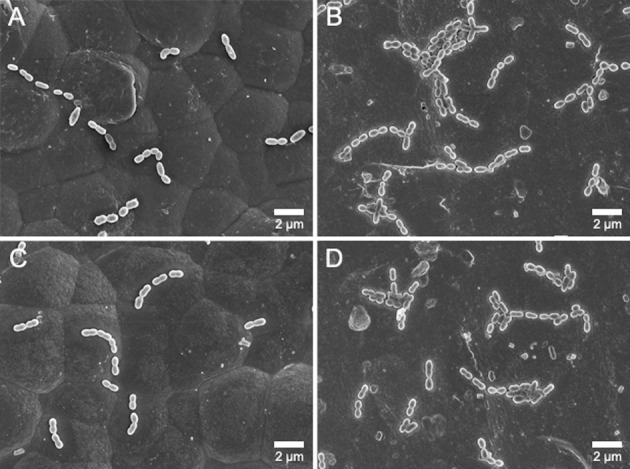
Figure 4.

FE-SEM images of bacterial adhesion to the orthodontic wires (original magnification 5000×, bar represents 2 µm). Low S mutans and S sobrinus adhesion to the DC wire (A and C, respectively). High S mutans and S sobrinus adhesion to the SN wire (B and D, respectively).
