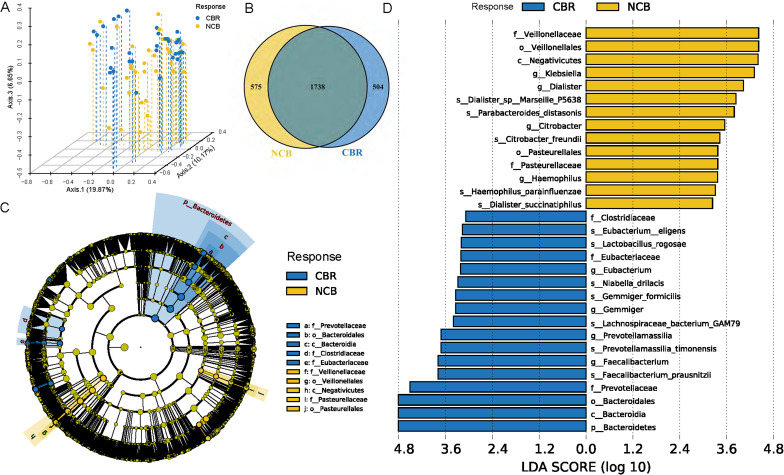
Figure 3.
Differential taxa were enriched in the CBR group and NCB group of the 65 patients with hepatobiliary cancers. (A) PCoA showed the beta diversity evaluated by Bray-Curtis distance between the CBR group and NCB group. (B) Common and unique taxa at the specie level between the CBR group and NCB group. (C) Taxonomic cladogram from LEfSe showed different taxa enriched in the CBR group and NCB group (LDA>3, p<0.05). (D) LEfSe identified significantly differentially abundant taxa in the CBR group and NCB group (LDA>3, p<0.05). CBR, clinical benefit response; LEfSe, linear discriminant analysis effect size; LDA, linear discriminant analysis; NCB, non-clinical benefit; PCoA, principal coordinate analysis.

