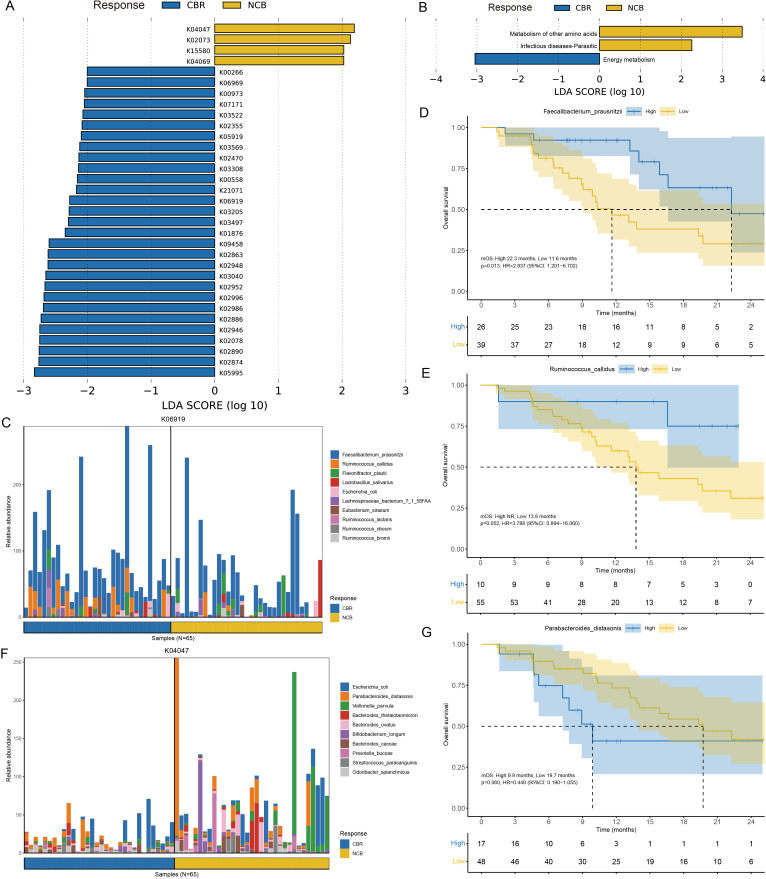
Figure 5.
Functional annotation of the gut microbiome metagenomic sequencing data. (A) Different KOs enriched in the CBR group and NCB group identified by LEfSe (LDA>2, p<0.05). (B) Functional pathways associated with the differentially-enriched KOs identified by LEfSe (LDA>2, p<0.05). (C) The top 10 bacterial species contributed to putative DNA primase/helicase (K06919) enrichment in the CBR group. (D–E) The Kaplan-Meier method with log-rank test estimates the mOS for patients with higher or lower abundance of Faecalibacterium prausnitzii and Ruminococcus callidus enriched in the CBR group. (F) The top 10 bacterial species contributed to starvation-inducible DNA-binding protein (K04047) enrichment in the NCB group. (G) The Kaplan-Meier method with log-rank test estimates the mOS for patients with higher or lower abundance of Parabacteroides distasonis enriched in the NCB group. CBR, clinical benefit response; KEGG, Kyoto Encyclopedia of Genes and Genomes; KOs, KEGG Orthologous groups; LDA, linear discriminant analysis; LEfSe, linear discriminant analysis effect size; mOS, median overall survival; NCB, non-clinical benefit.

