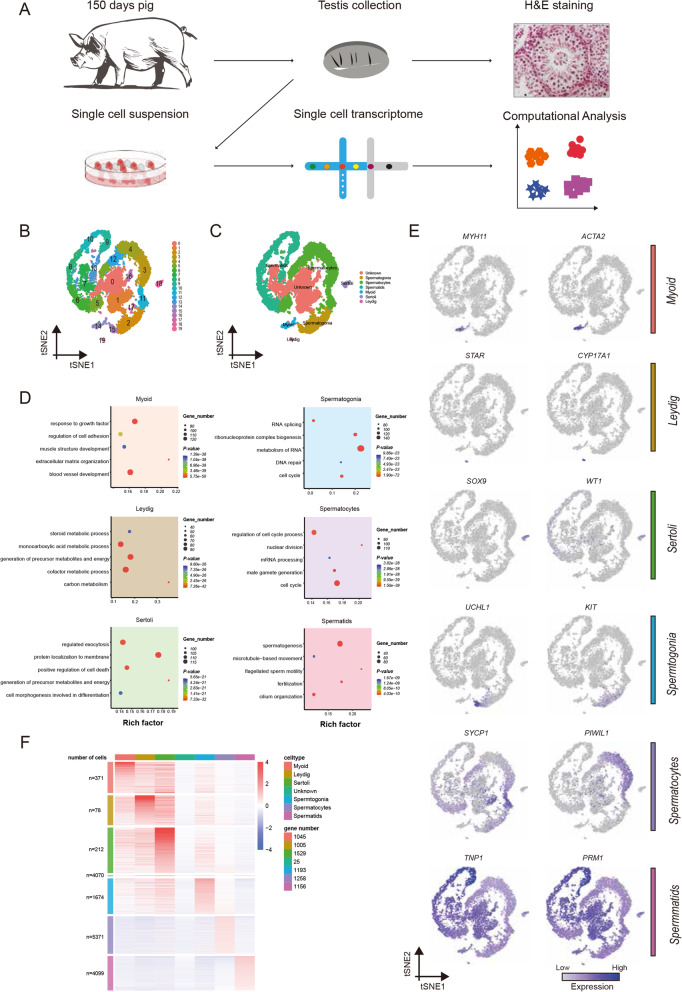
Fig. 1.
Single-cell transcriptome profiling and the cluster identification of porcine testicular cells. (A) Overview of the experimental design yielding droplet-based scRNA-Seq from porcine testis while using the contralateral testis for matched histology. (B) t-SNE plots show the 10 × Genomics profiling of unselected spermatogenic cells from porcine testis. Unbiased cell clusters are distinguished by color according to the key. (C) t-SNE plots show the identified cell types (cells are colored by the 6 broad cell types, and unknown cell type). (D) Enrichment terms and P values for the identified cell types (terms are colored by the 6 broad cell types). (E) Visualization of selected marker gene expression across all single cells in the t-SNE plot. For each cell cluster, 2 cell markers are shown in the Fig. (F) Scaled, normalized expression counts of the marker genes per cell type. Column and Row labels represent the cell type and the number of genes

