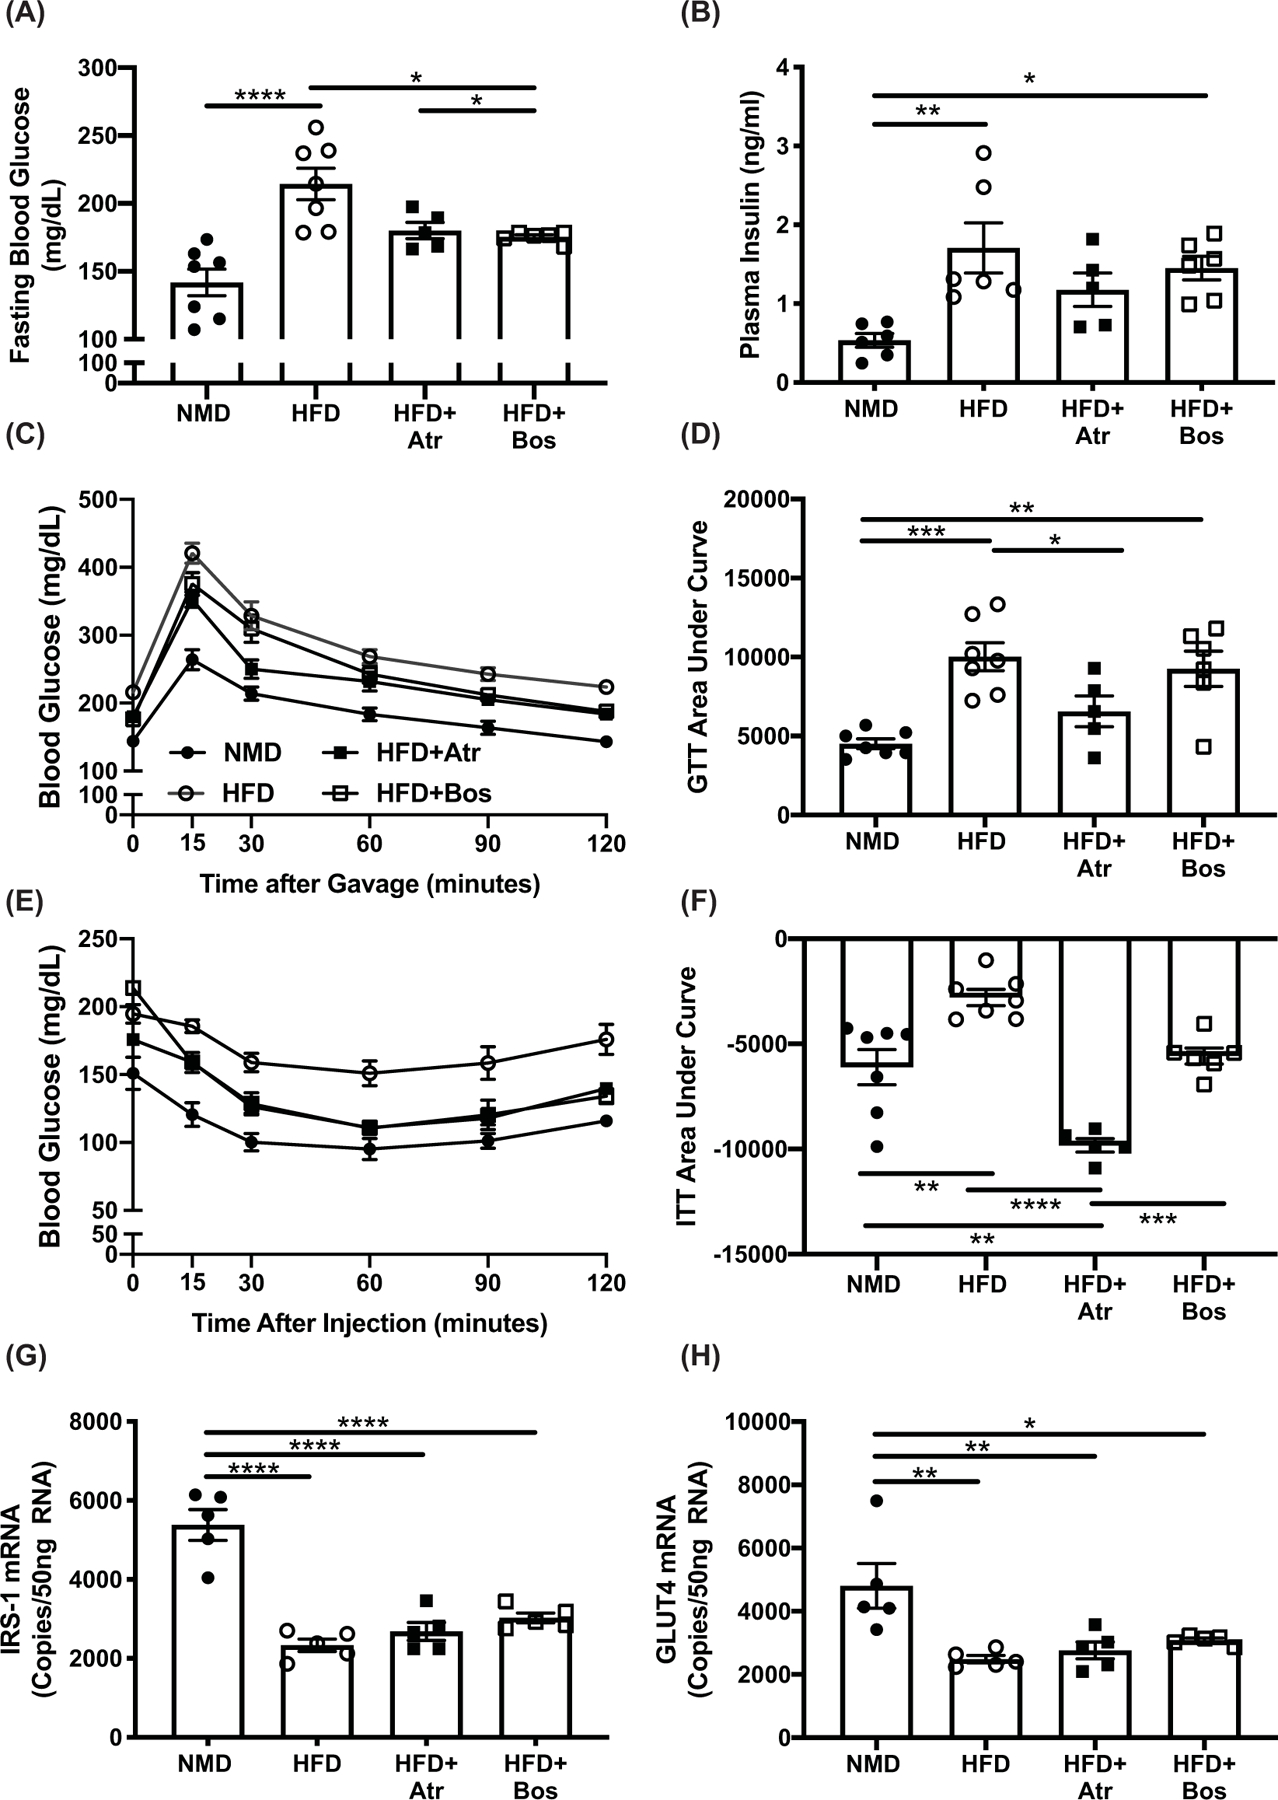
Figure 3. ET-1 receptor blockade reduces blood glucose and improves insulin tolerance in HFD-fed mice.

In vivo glucose homeostasis was determined by OGTT (A) and IPITT (C) for of NMD (n=7), HFD (n=7), HFD+Atr (n=5), and HFD+Bos (n=6) mice after 10 weeks on diet and 2 weeks of treatment with atrasentan or bosentan. Area under the curve for plasma insulin (B) and GTT (D). Fasting blood glucose was measured after a 6-h fast (E). Plasma insulin was measured via ELISA (n=5 per group). Data in (A,B,D,F–H) were analyzed by one-way ANOVA with Tukey’s post-hoc test for individual groups. Statistical analysis for panels (A,B,D,F–H) were done by one-way ANOVA with post-hoc Tukey’s test between individual groups, and panels (C,E) were analyzed by two-way ANOVA with repeated measures. Data are expressed as mean ± SEM. *P<0.05, **P<0.01, ***P<0.001, ****P<0.0001.
