
Figure 1: RNA-sequencing of cortical tissue reveals spatiotemporal gene expression at the device interface.
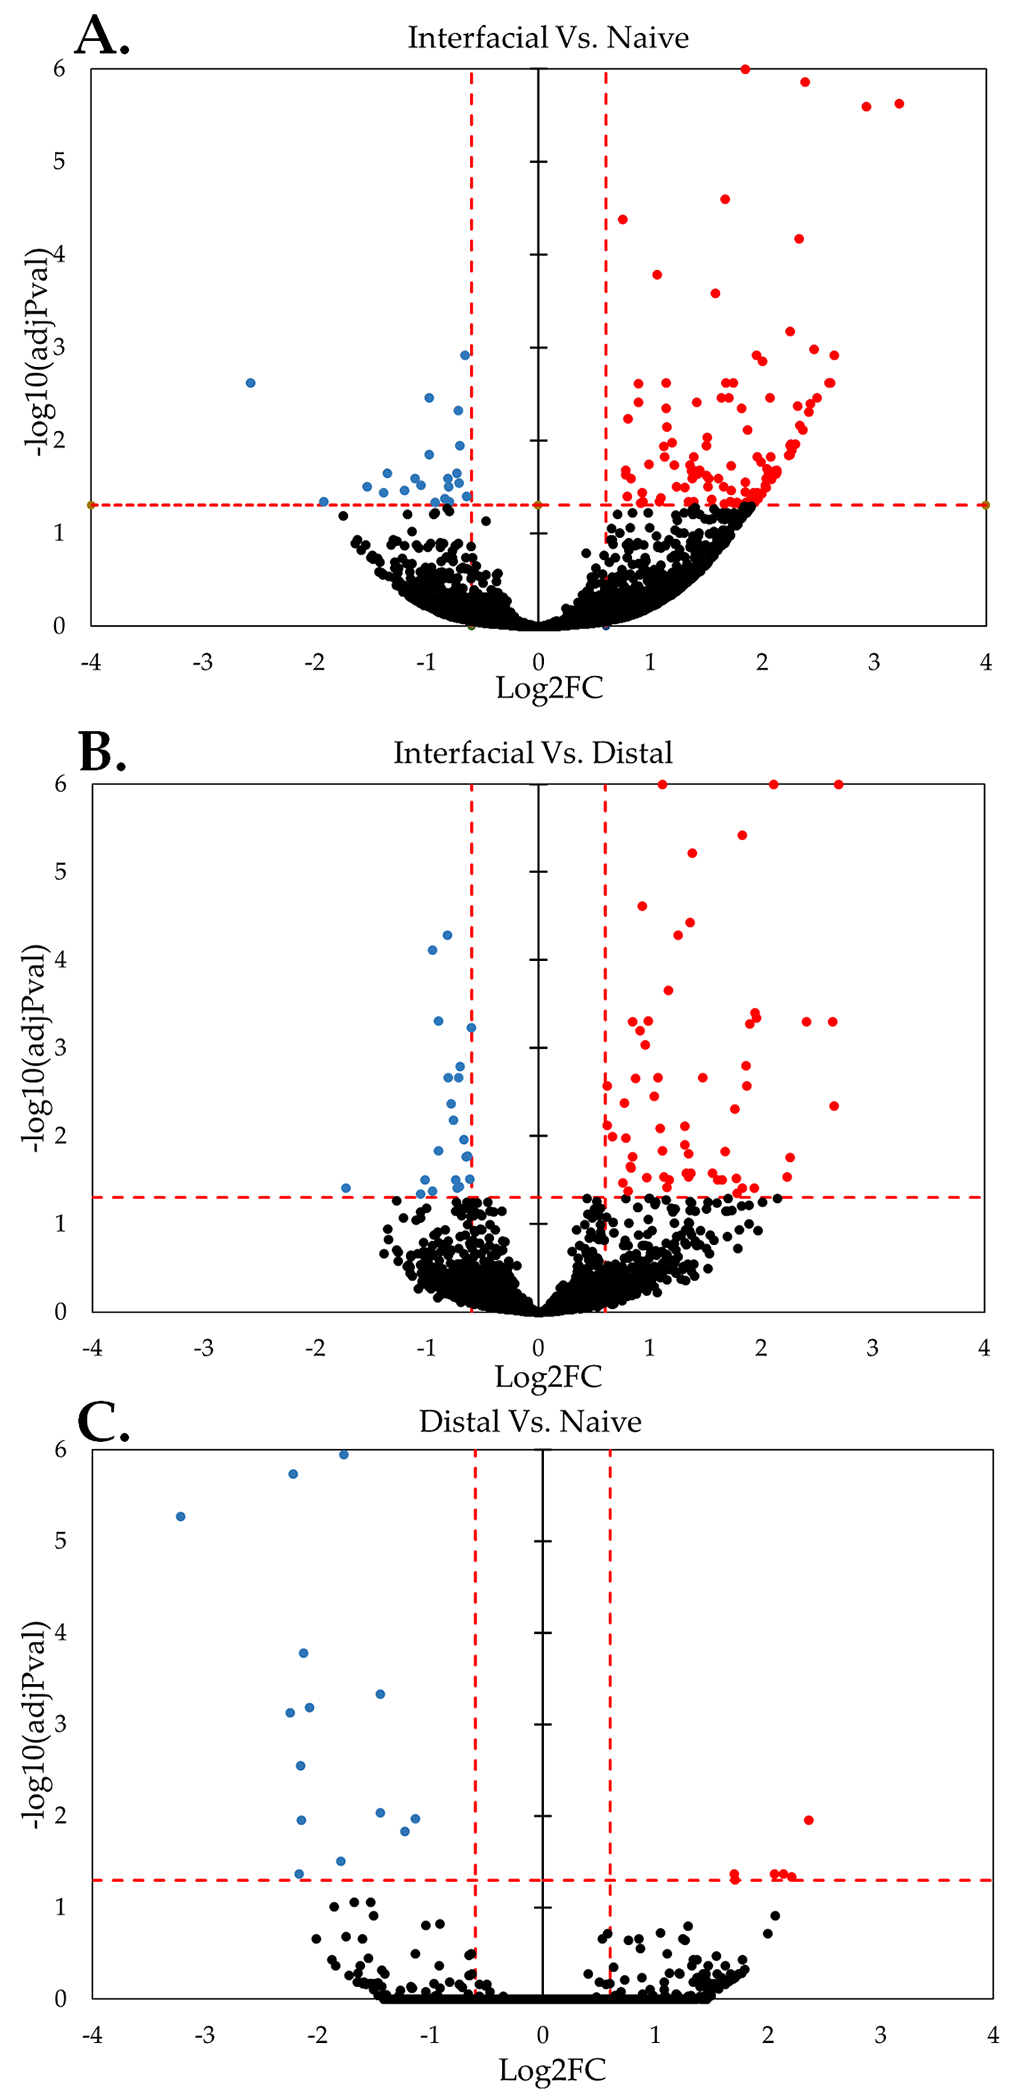
Volcano plots illustrate overall DE of genes at near-device relative to naïve tissue ((A) 157 DE genes), near relative to far tissue ((B) 94 DE genes), and far relative to naïve tissue ((C) 21 DE genes). “Overall” expression represents the group comparisons of samples pooled across time points. Significance was thresholded at Log2FC ≥ 0.6 and P ≤ 0.05 (dashed red lines). (Red: Upregulated DE, Blue: Downregulated DE, Black: Detected not DE)