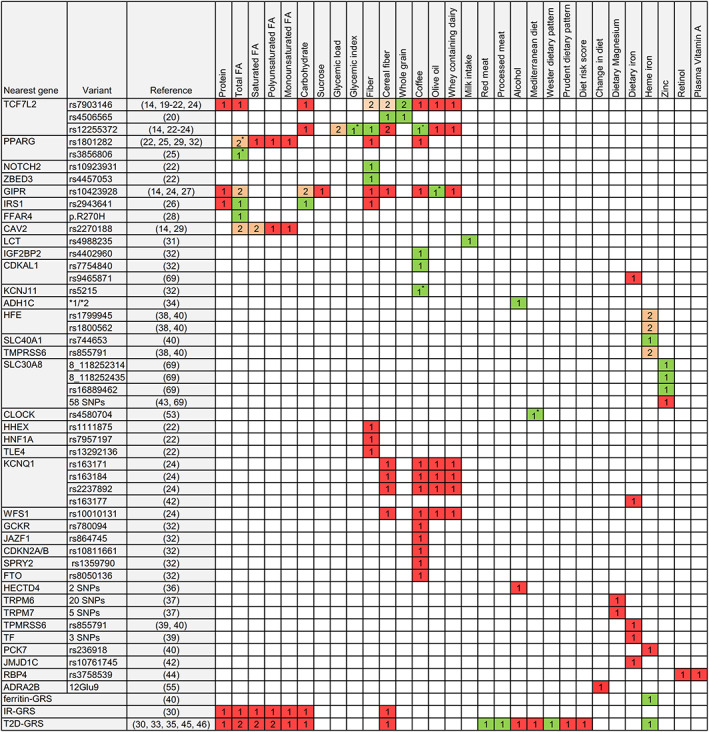
Figure 2.

Findings for interaction between genetic variants and diet in relation to T2D incidence. Numbers indicate how many studies investigated the respective gene‐diet interaction, green: interaction was found; red: no interaction was found; orange: contradictory interaction findings. The star sign next to the number indicates that there was only a trend for interaction. Abbreviations: FA, fatty acids; GRS, gene risk score; IR, insulin resistance; T2D, type 2 diabetes mellitus [Colour figure can be viewed at wileyonlinelibrary.com]
