
FIGURE 4.
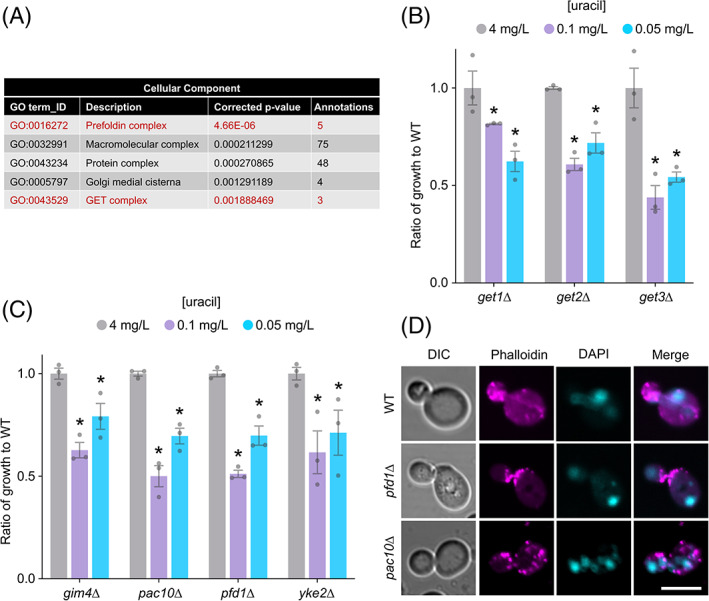
Low‐uracil screen identifies multi‐subunit complexes. (A) Gene ontology enrichment analysis for cellular component of the 150 factors identified from the screen. (B) Ratio of growth compared to wild‐type cells at 4, 0.1 and 0.05 mg/L uracil for GET complex mutants: get1∆, get2∆ and get3∆. Asterisks (*) indicate Student t test comparisons P = <.001. (C) Ratio of growth compared to wild‐type cells at 4, 0.1 and 0.05 mg/L uracil for indicated prefoldin complex mutants: gim4∆, pac10∆, pfd1∆ and yke2∆. Asterisks (*) indicate Student t test comparisons P = <.01. (D) Confocal microscopy of wild‐type (WT) and prefoldin mutants: pfd1∆ and pac10∆ stained with actin dye Phalloidin‐594 and nuclear dye DAPI and fixed with 4% paraformaldehyde. Scale bar = 5 μm