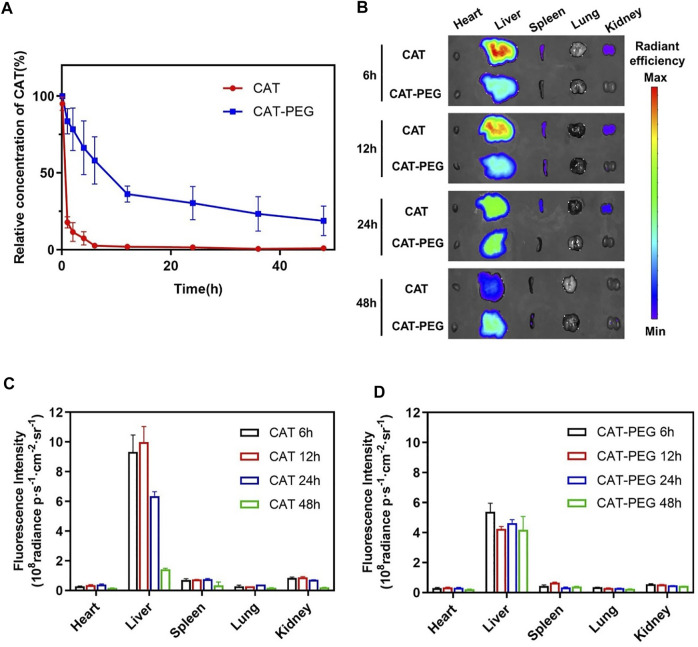
FIGURE 3.
Pharmacokinetics and biodistribution of CAT and CAT-PEG. (A) Pharmacokinetics of CAT and CAT-PEG after intravenous administration of 5 mg/kg−1 CAT or CAT-PEG. (B) Fluorescence imaging of the major organs after intravenous administration of 5 mg/kg−1 sulfo-Cy7-labeled CAT or CAT-PEG. (C, D) Quantitative analysis of the accumulation of CAT (C) and CAT-PEG (D) in the organs. n = 3. Data represent means ± s.e.m. Pharmacokinetics and biodistribution of CAT-PEG in mice.

