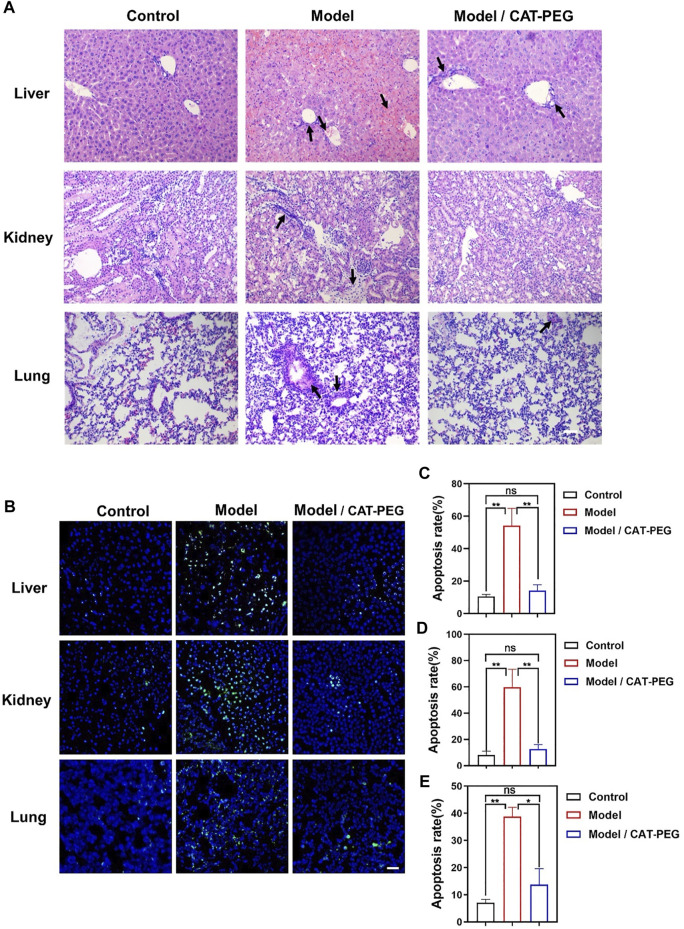
FIGURE 5.
Histologic analysis of the control, model, and treatment group. (A) Representative H and E staining sections of the major organs (Original Magnification ×200). (B) Terminal deoxynucleotidyl transferase dUTP nick-end labeling (TUNEL) staining of the liver, kidney, and lung sections. Scale bar: 50 μm. The nucleus was stained with DAPI (blue). Apoptotic cells were stained showing green color. (C–E) The percentage of TUNEL positive cells, which was counted by Leica TCS SP8 Confocal laser scanning microscope for each section and counted at least three viewing fields in each experiment. The tissue from top to bottom: liver, kidney, and lung. n = 3. Data represent means ± s.e.m. *p<0.05 and **p<0.01. ns means not significant.

