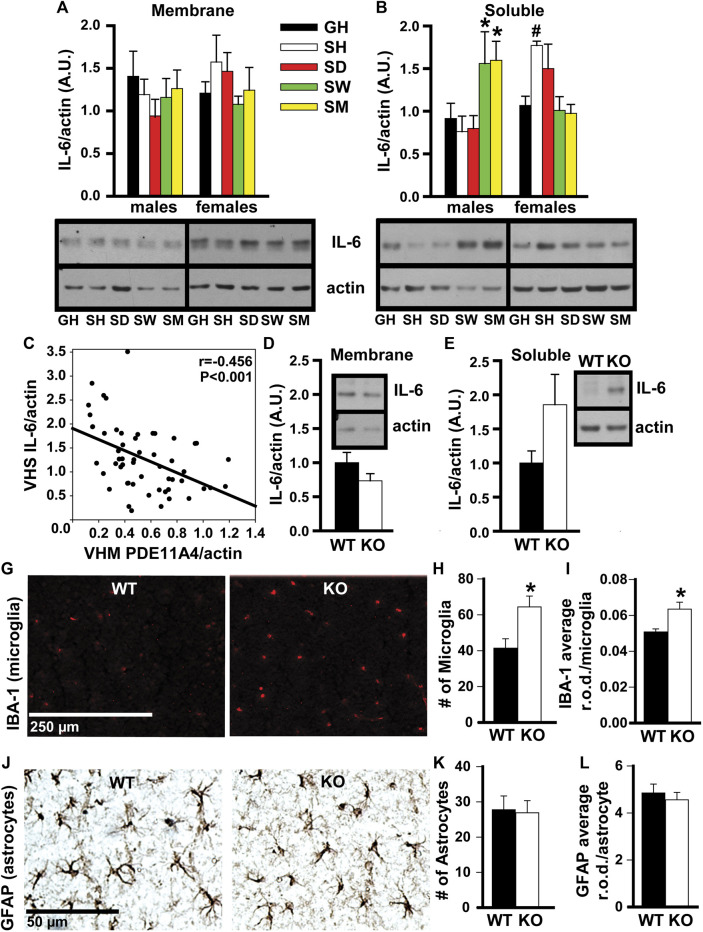
FIGURE 4.
In adult mice, social isolation and decreased PDE11A4 signaling upregulate markers associated with neuroinflammation. Previous studies comparing expression of PDE11A and the cytokine interleukin-6 (IL-6) between mouse strains determined lower expression of PDE11A4 in ventral hippocampal membranes (VHM) correlated with higher expression of IL-6 in ventral hippocampal the soluble fractions (VHS) (Pathak et al., 2017). (A) Similarly, western blots of ventral hippocampal fractions from adult group housed mice (GH) versus adult mice single-housed for 1 h (SH), 1 day (SD), 1 week (SW), or 1 month (SM) show that social isolation does not significantly affect IL-6 expression in the membrane compartment of the VHIPP (n = 7–8/group/sex; effect of group x sex: F (4,55) = 1.58, P = 0.192), (B) but does increase IL-6 expression in the soluble fraction, albeit at different time points for each sex (n = 7–8/group/sex; effect of group x sex: F (4,51) = 6.52, p < 0.001; Post hoc: GH-M vs SM-M and SW-M, P = 0.046-0.025 and GH-F vs SH-F, P = 0.062; however, paired t-test GH-F vs SH-F: t (6) = 4.404, FDR-P = 0.02). Consistent with our previous work (Pathak et al., 2017), (C) expression of VHM PDE11A4 in isolated mice correlated negatively with VHS IL-6 (r = -0.456, p < 0.001). To determine if a loss of PDE11A4 signaling is sufficient to increase soluble IL-6, we compared IL-6 expression in VHIPP fractions from Pde11a WT vs KO mice (n = 8-9F, 2M/genotype). (D) Genetic deletion of PDE11A did not alter IL-6 expression in the membrane compartment (n = 10/genotype, t (8) = 1.45, p = 0.186) but (E) did increase IL-6 expression in the soluble fraction with an effect size comparable to that observed in the isolated mice (n = 10/genotype, t (8) = 2.033, p = 0.076). Next, we determined a potential source of this increased IL-6. (G) Immunofluorescence for a marker of microglia shows that, (H) relative to Pde11a WT mice, Pde11a KO mice exhibit more microglia in the VHIPP (n = 5/genotype, t (8) = -2.88, p = 0.02) (I) and higher levels of IBA-1 expression per microglia (n = 5/genotype, t (8) = -3.03, p = 0.02). (J) In contrast, we see no change in the number of astrocytes within the VHIPP of Pde11a KO mice (n = 4M and 5F/genotype; effect of genotype: t (16) = 0.17, P = 0.867) (K) nor in the level of GFAP expressed by each astrocyte (t (16) = 0.59, P = 0.566). Post Hoc *vs GH, P = 0.046-0.025; #vs GH, FDR-P = 0.02. Data are plotted as means ± SEMs. Brightness and contrast of images adjusted for graphical clarity.

