
Figure S3.
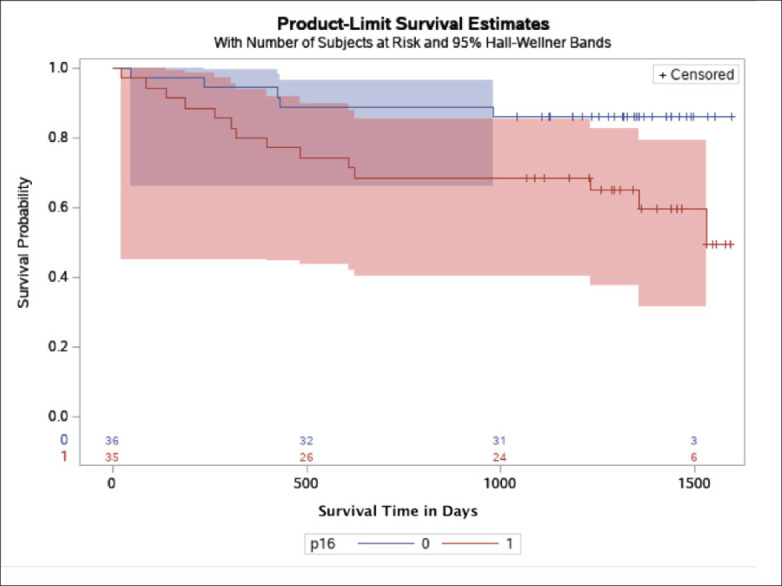
Kaplan-Meier (survival) plot by p16INK4a expression in the KFSHRC cohort, with Hall-Wellner 95% confidence bands. Cases with positive p16INK4a expression are represented by the red band; cases negative for p16INK4a expression are represented by the blue band. The numbers on the x axis are the number of patients at high risk by the p16INK4a expression groups.