Fig. 5.
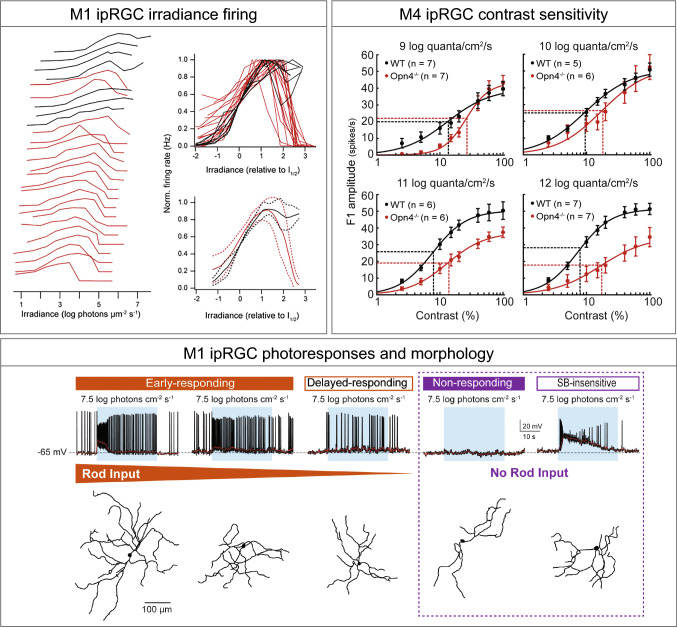
Re-evaluating the roles of ipRGCs. M1 ipRGCs irradiance firing box: every individual M1 cell operates over a narrow range and the population covers irradiances from moonlight to full daylight (left); relations overlaid and aligned by I1/2 for comparison of shape (right) [109]. Melanopsin signaling in both M1 and M4 is active into the scotopic range. M4 ipRGC contrast sensitivity box: contrast response functions of M4 cells in WT (black) and Opn4−/− (red) retinas recorded at background light levels from 9 to 12 log quanta/cm2/s. Vertical dotted lines indicate C50 and horizontal dotted lines indicate half-maximal response [55]. M1 ipRGC photoresponses and morphology box: top, representative recording examples, each from various types of M1 response arranged based on degree of rod input (orange gradient). Blue rectangle indicates start and end of light stimulus. Bottom, dendrite tracing image for each recorded cell [111]

