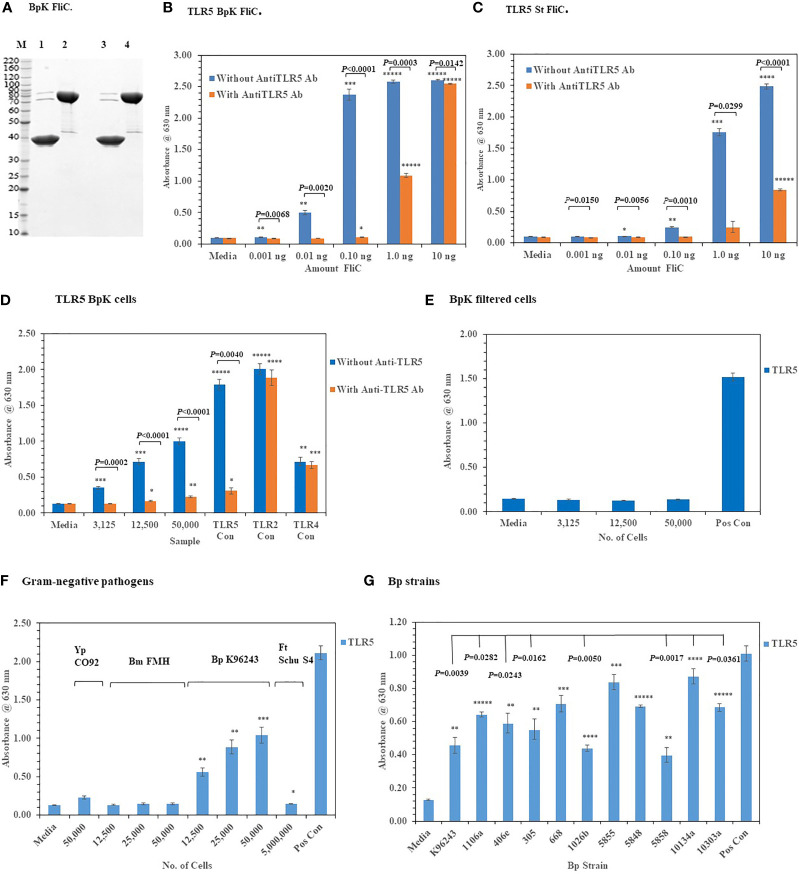
Figure 7.
Activation of TLR5 by either flagellin or flagella. (A) Polyacrylamide gel electrophoresis (10.5−14% Criterion, Tris-HCl gel) of purified Bp K96243 flagellin preparations (5 µg each): M, marker; lane 1, FliC sample heated and reduced, prior to loading; lane 2, His6-MBP-tev-BpKFliC (uncleaved tev Bp K96243 FliC) sample heated and reduced, prior to loading; lane3, FliC, without heating or reducing; lane 4, His6-MBP-tev-BpKFliC without heating or reducing. (B) TLR5 activation by increasing amounts of Bp K96243 FliC with and without anti-TLR5 monoclonal antibody (100 ng). Significant differences in TLR5 activity with and without anti-TLR5 anti-TLR5 antibody are shown above. (C) TLR5 activation by increasing amounts of St FliC with and without anti-TLR5 monoclonal antibody (mAb) (100 ng). (D) Activation of TLR5 by live Bp K96243 cells can be inhibited by an anti-TLR5 mAb but not TLR2 or TLR4. Varying amounts of Bp K96243 cells was used to inoculate HEK293-TLR5 cells. Also, HEK 293 -TLR5, -TLR2, and -TLR4 cells with their respective positive control antigens were examined. All TLR activation samples were examined with and without anti-TLR5 mAb (100 ng). (E) Activation of TLR5 after filtration of Bp K96243 cells used in Figure 7D . Equivalent amounts of filtrate (in 20 µl) that contained 3,125, 12,500, and 50,000 Bp K96243 cells before filtration (0.2 µm) was added to HEK293-TLR5 cells and activation evaluated. The positive control was not filtered. (F) Activation of TLR5 by live Gram-negative pathogens. Gram-negative pathogens Yp CO92, Bm FMH, Bp K96243, and Ft Schu S4) were grown as described in the Material and Methods, and bacterial cell suspensions were used to inoculate HEK293-TLR5 cells. After overnight incubation (~20 h) at 37°C with 5% CO2, the absorbance of the plates were read at 630 nm. The media control was PBS, and the positive control (Pos Con) was St FliC (2 ng). (G) Activation of TLR5 by live cells of Bp spp. Bp spp. listed in Table 1 were grown as described in the Material and Methods and used to inoculate HEK293-TLR5 cells as indicated. After overnight incubation (~20 h) at 37°C with 5% CO2, the absorbance of the plates were read at 630 nm. Although different amounts of cells were examined for TLR5 activity (6,250, 25,000, and 100,000 cells), for display purposes we only show the results for 100,000 cells, which gave the highest activity in all cases except one strain (Bp 406e). In this latter case, there was no statistical difference between the two highest cell concentration used. Statistical differences between the Bp strain with highest TLR5 activity (Bp HBPUB10134a) and the other strains is shown above in the figure. Results of TLR activation are presented as geometric mean with standard error of the mean. TLR5 activation samples were analyzed in triplicate and results represent one of two independent repeats. The media control was PBS. Significant differences between samples are shown above the results. Significant values compared to media control are shown: *P ≤ 0.05; **P ≤ 0.01; ***P ≤ 0.001; ****P ≤ 0.0001; *****P ≤ 0.00001.

