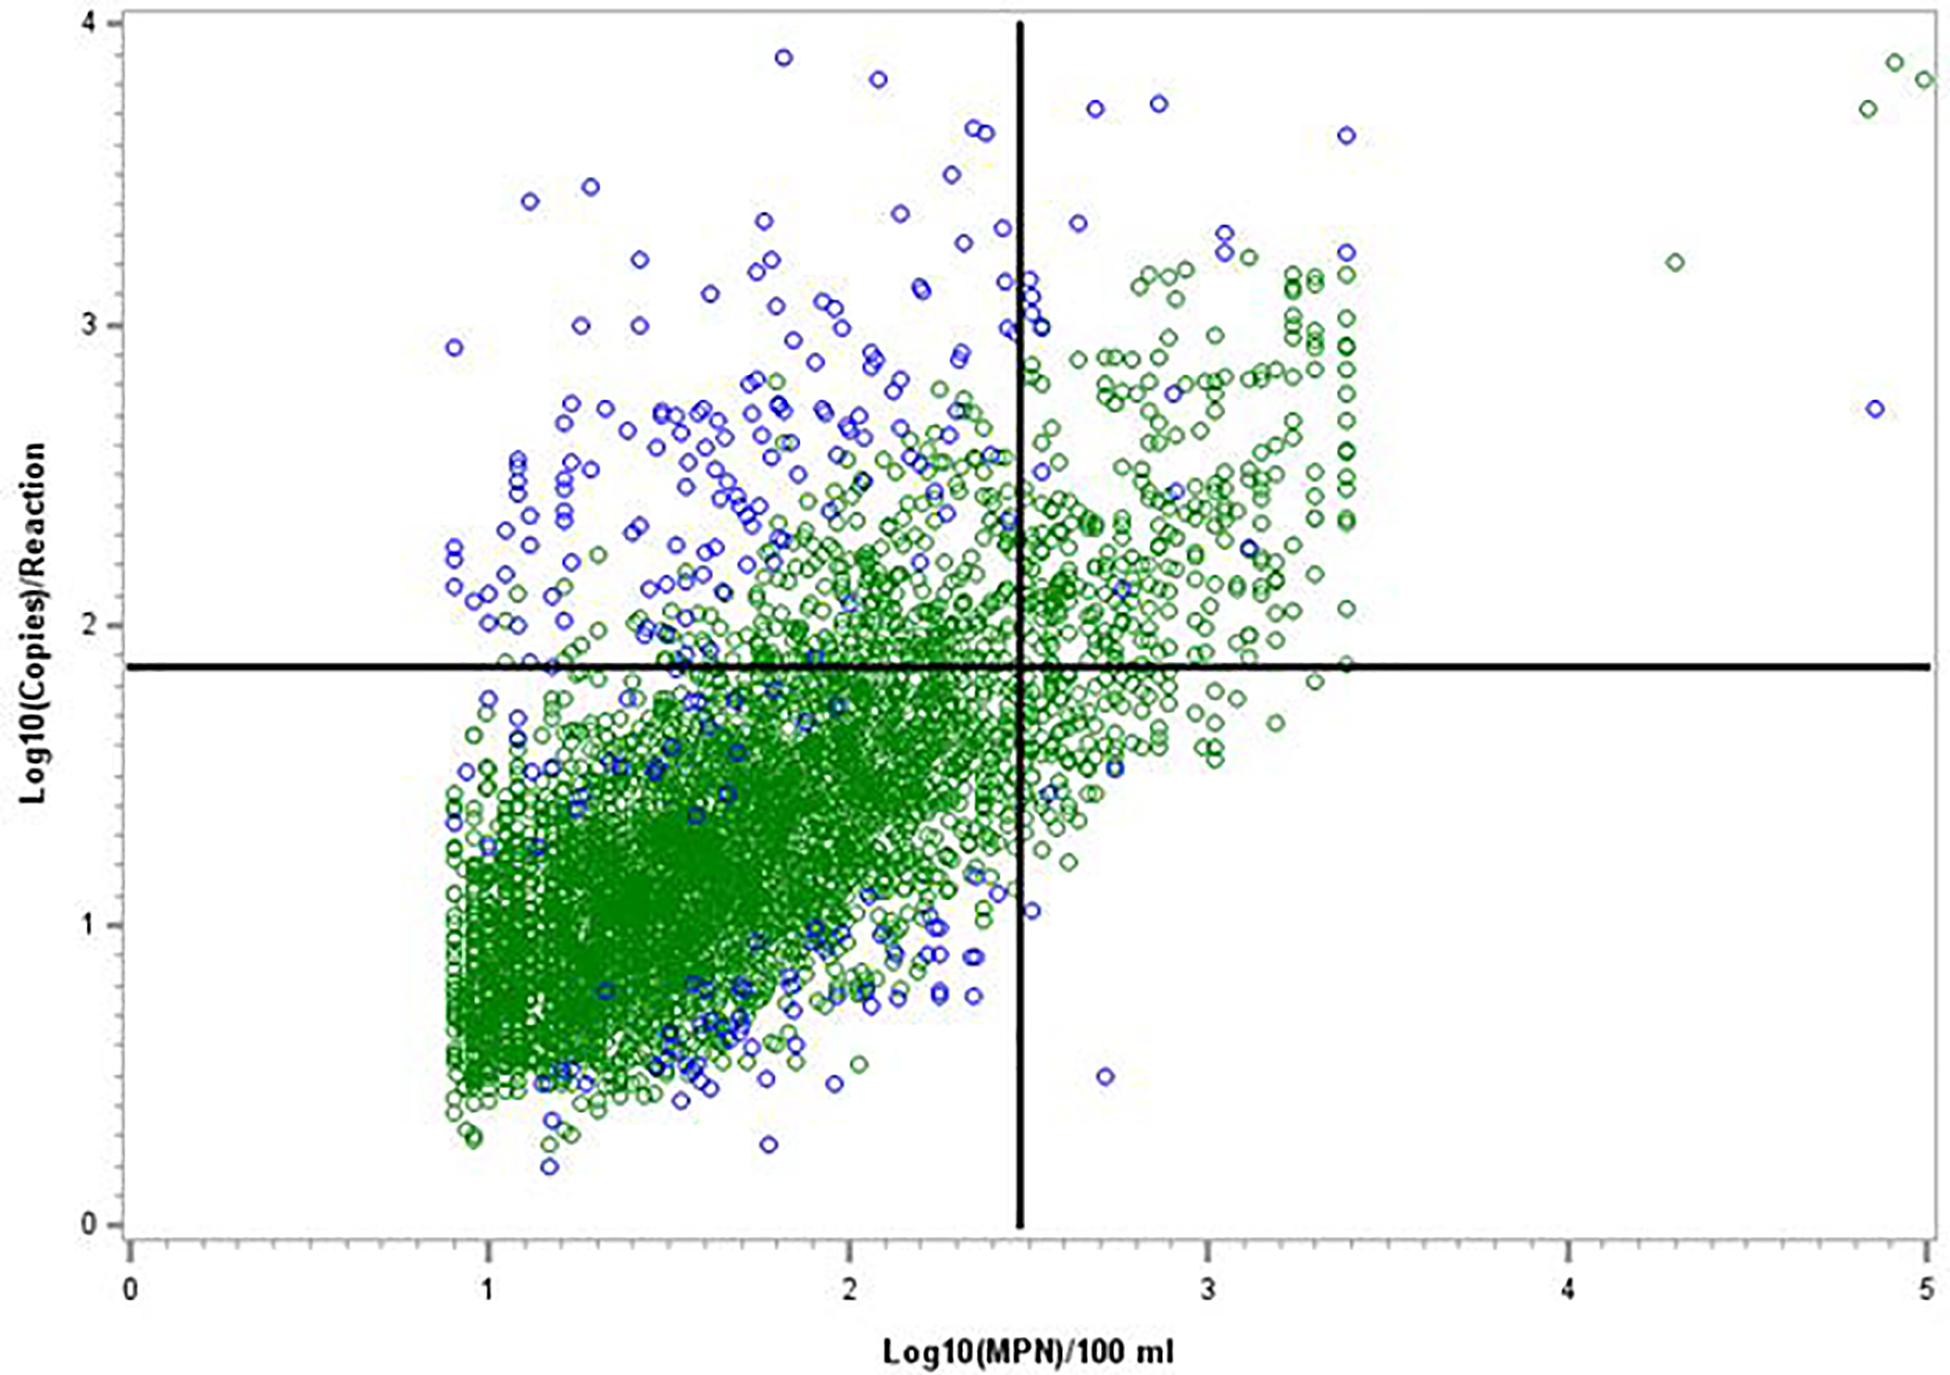
Figure 2.

Comparison of E. coli culture method and Method C results with respective actual or theoretical threshold values. Vertical line indicates the culture method water quality standard of 300 E. coli MPN or CFU / 100 mL for beach notifications in Michigan. Horizontal line indicates a theoretical Method C beach notification threshold of 1.863 log10 copies/reaction that could be considered to correspond to the culture method standard. Data points are from 4305 samples with quantitative results for both methods (Table 2). Blue data points represent data pairs that were identified as statistical outliers in regression analyses of the paired datasets from each individual site.
