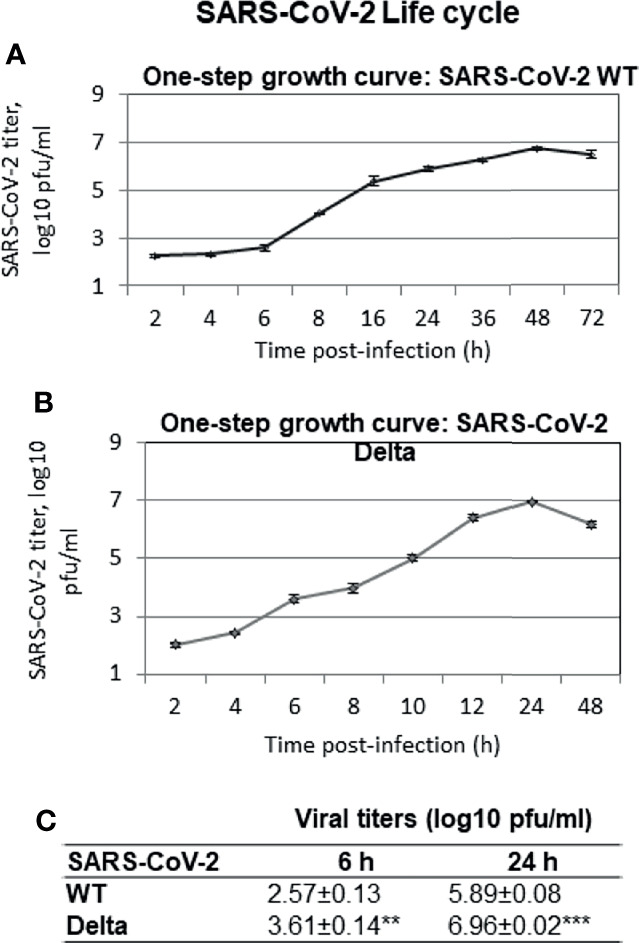
Figure 2.

SARS-CoV-2 life cycle. Confluent monolayers of Vero cells, in triplicates, were infected with SARS-CoV-2 at MOI of 5 and thereafter washed with PBS, and fresh MEM was added. Infectious progeny virus particles released in the infected cell culture supernatant at indicated time points were quantified by plaque assay. One-step growth curve of WT (A) and Delta variant (B) of SARS-CoV-2 is shown. Statistical comparisons of viral titers (WT versus Delta SARS-CoV-2) were performed at 6 hpi (when progeny virus particles start appearing in the infected cell culture supernatant) and at 24 hpi (when Delta virus is about to complete its life cycle) by two-tailed Student’s t-test (C). **p < 0.01, ***p < 0.001.
