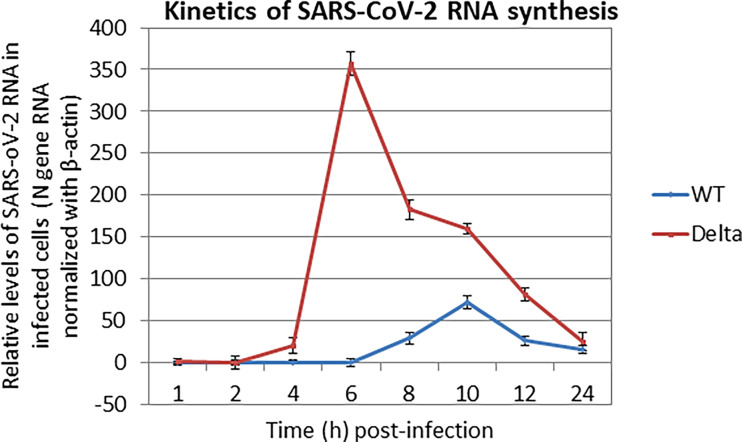
Figure 3.
Kinetics of SARS-CoV-2 RNA synthesis. Confluent monolayers of Vero cells, in triplicates were infected with SARS-CoV-2 at MOI of 5, followed by washing with PBS and addition of fresh MEM. Cells were scrapped at indicated time points and subjected for the quantitation of SARS-CoV-2 RNA (N gene) by qRT-PCR. cT values were normalized with β-actin housekeeping control gene, and relative % fold change in viral RNA copy numbers at various time points (as compared to 1 hpi) was calculated by ΔΔCt method.

