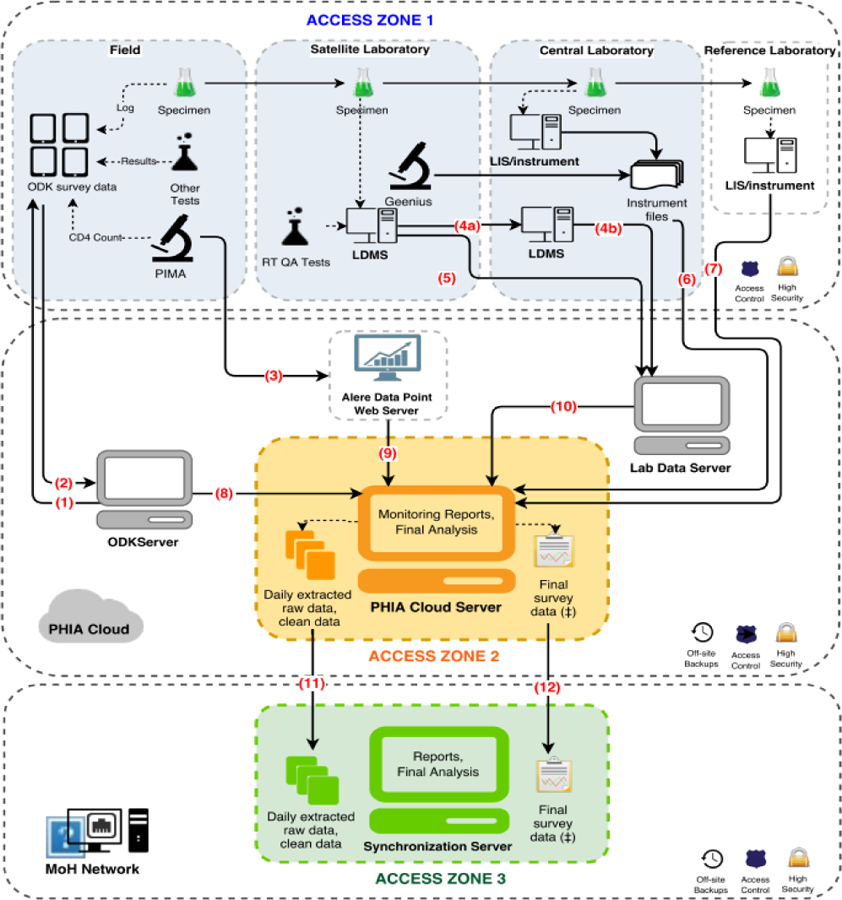
Figure 1: Data Architecture, for Population-based HIV Impact Assessments in Zimbabwe, Malawi, and Zambia, 2015 – 2016.

At completion of all study activities in the household, supervisors uploaded data from the tablets (1) to a secure cloud server via a Wi-Fi or 3G network connection using a pocket wireless router (2). CD4+ cell counts and their associated participant identification number (PTIDs) were uploaded from the CD4 PIMA analyzer via Wi-Fi or 3G network to a secure cloud server (3) and subsequently merged with the survey database. Both satellite and central laboratories used a Laboratory Data Management System (LDMS) (Frontier Science, Boston, Massachusetts) database to track specimen receipt, processing, freezing times, quantity, quality assurance testing data, storage location. and shipment details which were transmitted to Frontier Science using encrypted flash drives (4a, 4b) or directly (5). Central laboratory-based test results, including viral load, early infant diagnosis, and HIV recency were either pulled directly from the local laboratory information management system (LIMS) or sent in files extracted from the test instruments and uploaded to a secure FTP server and appended to the database (6, 7). Questionnaire data from the ODK server, CD4 data and LDMS quality assurance/quality control (QA/QC) data that went through intermediary servers were all linked with the overall database (8, 9, 10). The overall survey database was sent daily to an in-country server for local stakeholders to access and monitor (11). After completion of data cleaning, finalized data was also transferred to an in-country server (12).
